How does noise influence high absorbance measurements?
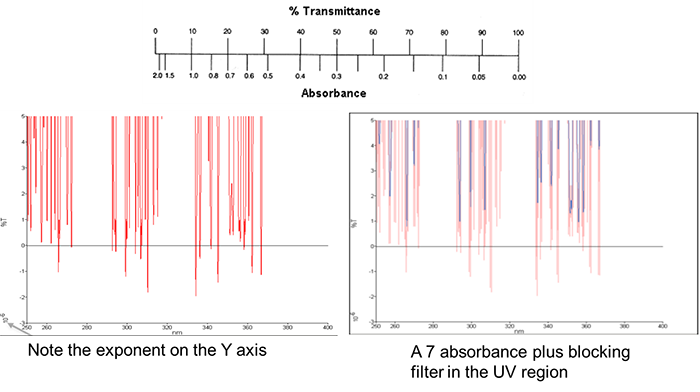
Spectrophotometers are unable to measure sample absorbance directly. They can only directly measure transmittance of a sample. Absorbance is a post data acquisition processing step. This fact is critical in understanding high absorbance spectra. High absorbance samples should always be measured in %T mode, this is so that one can directly see what is happening to the signal in the instrument. The spectrum above is a 7 plus absorbance blocking filter. Note the %T values for the blocking regions. The values are so close to zero %T that some of the values are negative due to instrumental noise. This causes a slight data handling problem for the absorbance processing step.
Above is a graphical representation of the relationship between percent transmission and absorbance values. The logarithmic nature of absorbance is apparent. On the bottom is the Beer’s Law conversion from percent transmission to absorbance. Remember those negative %T values due to noise for a highly absorbing sample? They represent a real problem. What is the logarithm of a negative number? The Log function Y = Logb (X) is the inverse of the exponential function X = bY. Since the base b is positive (b>0), the base b raised to the power of Y must be positive (bY>0) for any real value of y; therefore, the number x must be positive (x>0) as well. So, the real base b logarithm of a negative number must be undefined.
Since spectra cannot have “holes” in the wavelength axis due to undefined absorbance values, something must be done. The only solution is to “substitute” a real value that is on the same order of magnitude as the noise data. While this data can serve as a “placeholder”, it is inserting an unmeasured, artifactual value into the spectrum.
One methodology that can be employed to eliminate the negative %T values is to minimally smooth the original percent transmission spectrum. This smoothing “averages” the data above the 0 %T threshold; thereby, eliminating the negative values in the native spectrum. This result can be seen in the spectra on the right obtained from that 7 plus absorbance blocking filter. The original raw data, red spectrum, is subject to a 5-point smoothing which results in the blue spectrum where all %T values are positive. The resulting absorbance transformation would then be free from any artifactual data due to “undefined” absorbance from negative %T numbers. Since the correct minimal level of smoothing is basically a “trial and error” procedure, this type of methodology is difficult to automate properly in instrument software.