North America
Analytical and Measuring Instruments
JavaScript Disabled
Our website uses JavaScript. Please confirm that JavaScript is enabled in your browser.
MALDI-Based Instruments and Solutions
Share
Add Bookmark
MALDI Theory and Basics
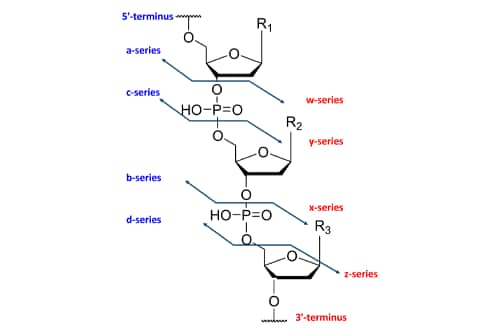
Intro to Oligonucleotide Analysis
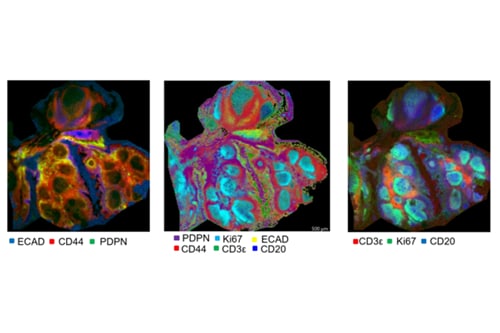
Intro to Mass Spectrometry Imaging (MSI)