Why is quantitative analysis always done in Absorbance rather than %Transmission?
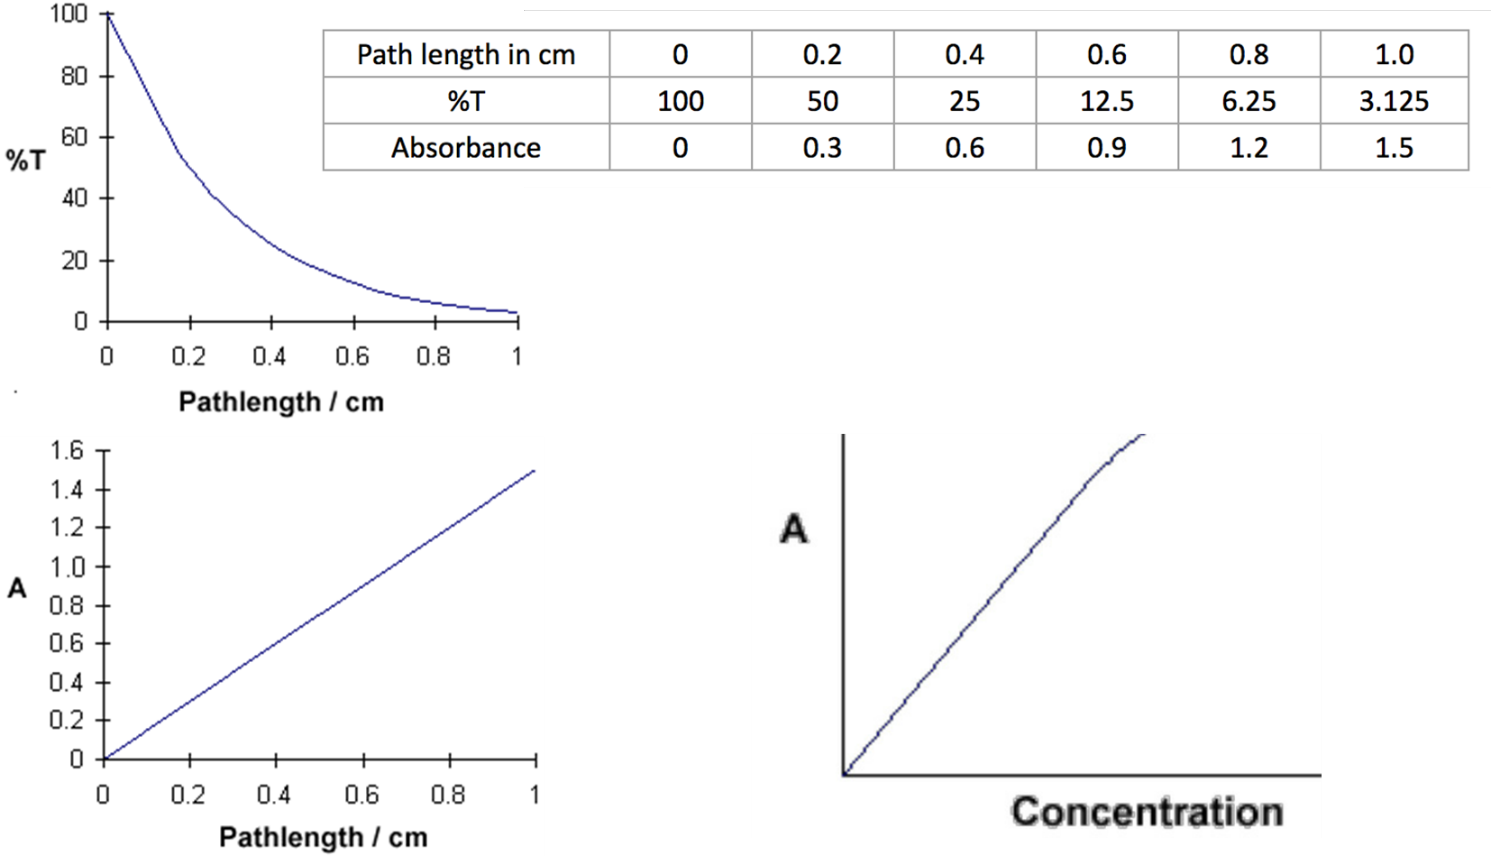
An example, now, suppose we have a solution of copper sulphate (which appears blue because it has an absorption maximum at 600 nm). We look at the way in which the intensity of the light changes as it passes through the solution in a 1 cm cuvette. We will look at the reduction every 0.2 cm as shown in the diagram above. Beer’s Law says that the fraction of the light absorbed by each layer of solution is the same. For our illustration, we will suppose that this fraction is 0.5 for each 0.2 cm “layer” and calculate the data table (upper right).
This data can be graphed to better see the relationship. For %T the plot displays a curve (upper left). However, for absorbance the relationship is a straight line (lower left). This is a crucial difference from %T. Scientists love straight lines rather than curves. Why? Because it is easier to mathematically model a straight line as opposed to a curve.
The equation A = abc tells us that absorbance depends on the total quantity of the absorbing compound in the light path through the cuvette (lower right). If we plot absorbance at the peak wavelength against concentration, we get a straight line passing through the origin (0,0). The linear relationship between concentration and absorbance is both simple and straightforward, which is why we prefer to express the Beer-Lambert law using absorbance as a measure of the absorption rather than %T. From this, it is clear that one would use absorbance as the scale for any UV/Vis/NIR application that involved quantitation. With absorbance we can use spectroscopy to measure how much of something is present.