What is stray light?
Stray light, along with detector sensitivity, work together to define the upper absorbance limit in dispersive UV/Visible/NIR spectrophotometers. However, the stray light value is the primary specification that limits the maximum sample absorbance possible for any instrument. Stray light is defined as any light that reaches the detector which is outside the spectral region isolated by the monochromator. High stray light frequently leads to deviations from the Beer-Lambert Law, with subsequent inaccuracies in sample photometric values. In theory stray light dictates the dynamic range for most spectrophotometers. In general, the lower the stray light specification, the more expensive the instrument.
Stray light in an instrument is defined as light in the instrument that is not of the wavelength set on the monochromator. For example, if the monochromator is set to 600 nm, then any light other than 600 nm is stray light. Stray light can originate from anywhere either inside (optics) or outside (light leaks) the instrument. Spectrophotometers that are well designed should not have stray light from either leaks or errant internal reflections. Typically, the primary source of stray light is from the diffraction grating component of the monochromator (above). There are flaws in the regular lines etched on the grating as a result of the manufacturing process and are the cause of most instrumental stray light. Modern holographic gratings produced by photo-lithographic processes have much lower stray light than the less expensive mechanically “ruled” gratings. To reduce stray light even more, two gratings can be used in series to achieve upper absorbance limits exceeding 6. By having the light reflect off of two gratings in series the stray light is significantly reduce from that of a single grating instrument.
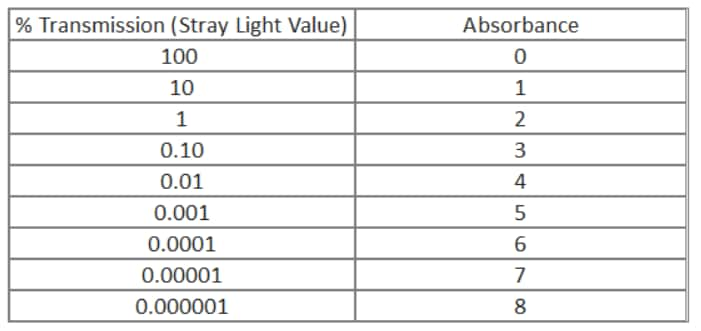
Stray light, by convention, is measured in percent transmission. This is not very useful when most users tend to think in absorbance, at least as far as dynamic range is concerned. As one can see from the conversion equation on the right, absorbance is a simple -log transformation of the transmission value. The chart enables us to visualize the transmission/absorbance relationship over many orders of magnitude. From this chart we can easily see that a spectrophotometer with a stray light specification of 0.01 %T will not be able to measure any sample over 4.0 absorbance units. In addition to setting the highest absorbance, the stray light introduces a photometric error that increases in significance as the sample %T value becomes lower and approaches the stray light value.