How does stray light result in varied absorbance ranges on different instruments?
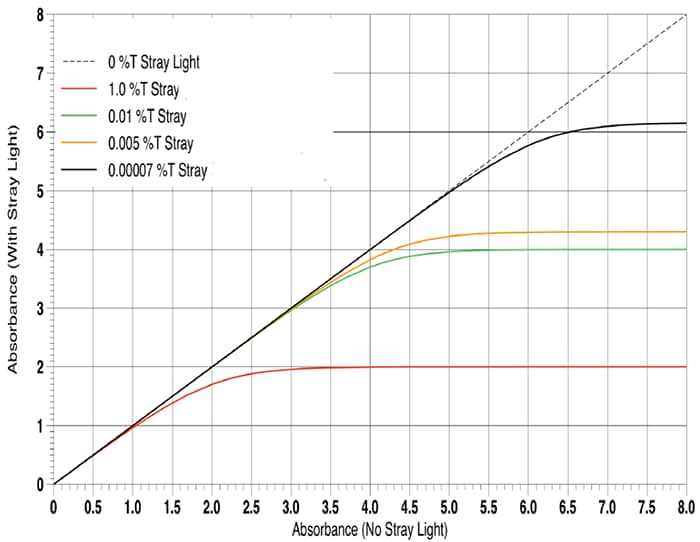
Pictured here are plots for various instruments having different stray light specifications. As you can see, the shapes of the plots are similar with only the Beer’s Law linearity cutoff point and the stray light plateau levels being different. The utility of this type of plot is that it defines the dynamic range envelope of any instrument based on its stray light specification.