ATR Precautions - Part2
ATR Precautions (Part 1) introduced the partial peak shifts due to differences in refractive index of the prism and the spectral changes due to the clamping force between the sample and prism. ATR Precautions (Part 2) describes precautions when using the ATR method for quantitative analysis.
1. Using the Peak Intensity Ratio
The peak intensity (absorbance) of an absorption spectrum is proportional to the peak absorption coefficient, lightpath length, and concentration. The peak absorption coefficient becomes a constant when the target component for quantitation and its peak of interest are determined. In addition, the light path length is constant for the fixed cells often used for the quantitative analysis of a liquid sample by transmittance methods. Consequently, the spectral peak intensity obtained is proportional only to the concentration. This means that a calibration curve can be obtained from the peak intensity obtained by measuring a standard sample of known concentration and the target component concentration. Such methods are known as multipoint calibration-curve methods (including single-point). The calibration curve is normally linear, as the peak intensity is proportional to the concentration.
With ATR, the "light path length" can be thought of as the product of the light penetration depth and the contact area. The penetration depth value depends on the prism refractive index, angle of incidence, sample refractive index, and position (wave number) of the peak of interest. However, these are constant once the peak of interest and ATR instrument are determined. Consequently, if measurements are conducted with a constant contact area, the peak intensity becomes proportional to the concentration. In practice, calibration curves with excellent linearity can be obtained for liquid samples by dripping the sample over the entire face of the prism during measurement. However, the measurement of solid samples with a constant contact area is difficult, as the contact area between a solid sample and the prism surface is dependent on the clamping force and the hardness and shape of the sample. Such differences in contact area are corrected using the peak intensity ratio, which is the peak intensity of the target component divided by the peak intensity of a main component. Therefore, if the contact area doubles, the peak intensity of the target component doubles but the peak intensity of the main component also doubles, such that the peak intensity ratio remains unchanged. Consequently, it is necessary to create a calibration curve for the peak intensity and concentration when measuring solid samples by ATR.
2. Effects of Contact Status
As described above, the peak intensity ratio can be used to correct for differences in contact area. However, this does not mean that the peak intensity can be ignored completely. Spectra obtained with significantly different contact areas have differences that cannot be corrected by the peak intensity ratio because of poorer calibration curve linearity and poorer result reproducibility.
Such "differences that cannot be corrected by the peak intensity ratio" are differences in the contact status. The contact status can be thought of as the amount of clearance between the prism and sample. The contact status affects the peak intensity ratio.
Fig. 1 shows the spectra for polystyrene measured at three levels of clamping force using a DuraSamplIR singlereflection attenuated total reflection instrument. Changes in the clamping force caused differences in contact area, which are apparent in the large differences in peak intensity across the entire spectrum. Fig 2 shows the normalization results on the peak near 1500 cm-1 in the three spectra. An enlarged diagram of the peak near 3000 cm-1 appears at the top-left of Fig. 2. If the differences were due to contact area alone, all peak intensities should match after normalization with a single peak intensity. However, they do not match in Fig. 2. In addition, the peak intensities are reversed between the high- and low-wave number ends. The changes in the clamping force result in changes in the contact status, in addition to the contact area, which change the peak intensity ratio as well as the peak intensities in the overall spectrum. The spectrum for a weak clamping force exhibits a relatively small peak intensity at the high-wave number end - similar characteristics to those exhibited in an ATR spectrum measured with poor contact status. As the contact status affects the peak intensity ratio, measurement of the contact status is also required during quantitative analysis, in particular.
Fig. 1 ATR Spectra of Polystyrene
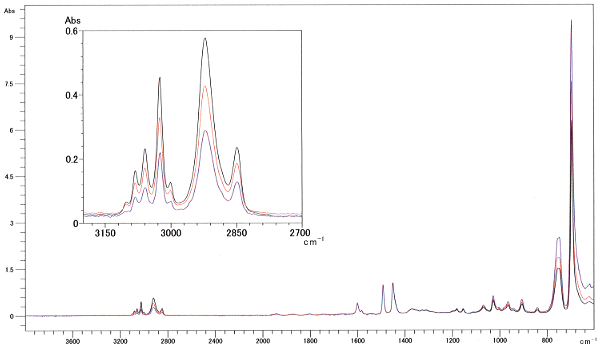
Fig. 2 Peak Normalization Near 1500 cm-1
3. Reproducibility of Peak Intensity Ratio
So, how should we match the contact status? Also, what degree of reproducibility can be achieved? Analysis results on Ethylene vinyl acetate copolymer with an ATR probe optical fiber system are introduced below as an example.
Fig. 3 ATR Spectra of Ethylene Vinyl Acetate Copolymer
Sample measurements were conducted five times each with the clamping force adjusted to achieve a peak intensity near 2920 cm-1 of approximately 0.7 ABS and 0.3 ABS in monitor measurement. Fig. 3 shows these ten spectra. The peaks near 2920 cm-1 and 2850 cm-1 are mainly C-H stretching vibrations of ethylene, while the peaks near 1735 cm-1 and 1235 cm-1 are vinyl acetate C=O and C-O vibrations, respectively. Consequently, the peak intensity ratio of the former and latter peaks changes due to the abundance ratio of vinyl acetate. The abundance ratio was constant for these measurements, as the same sample was measured multiple times. The reproducibility was checked using the peak height ratio between the peaks near 1735 cm-1 and 1235 cm-1 and the peak near 2920 cm-1. The results are shown in Table 1.
Table 1 indicates that the Cv% value calculated individually for similar levels of peak intensity are significantly improved compared to the Cv% value calculated using all spectra. Consequently, differences in contact status can be reduced and the reproducibility enhanced by matching the peak intensities during measurements. The improvement in reproducibility for peaks with high peak intensity is thought to be due to the lower effects of noise.
Table 1 Calculated Results of Peak Height Ratio
| Peak Height Ratio (*/2920 cm-1) |
1735 cm-1 | 1235 cm-1 | 1735 cm-1 | 1235 cm-1 | 1735 cm-1 | 1235 cm-1 |
|---|---|---|---|---|---|---|
| 0.7ABS-1 | 1.045 | 1.225 | 1.045 | 1.225 | ||
| 0.7ABS-2 | 1.044 | 1.217 | 1.044 | 1.217 | ||
| 0.7ABS-3 | 1.042 | 1.222 | 1.042 | 1.222 | ||
| 0.7ABS-4 | 1.045 | 1.231 | 1.045 | 1.231 | ||
| 0.7ABS-5 | 1.059 | 1.235 | 1.059 | 1.235 | ||
| 0.3ABS-1 | 1.182 | 1.251 | 1.182 | 1.251 | ||
| 0.3ABS-2 | 1.164 | 1.251 | 1.164 | 1.251 | ||
| 0.3ABS-3 | 1.171 | 1.267 | 1.171 | 1.267 | ||
| 0.3ABS-4 | 1.157 | 1.267 | 1.157 | 1.267 | ||
| 0.3ABS-5 | 1.151 | 1.274 | 1.151 | 1.274 | ||
| Mean | 1.106 | 1.244 | 1.047 | 1.226 | 1.165 | 1.262 |
| Standard deviation | 0.063 | 0.021 | 0.007 | 0.007 | 0.012 | 0.011 |
| Cv% | 5.693 | 1.670 | 0.652 | 0.580 | 1.066 | 0.835 |
Corrected in 1800 to 1612 cm-1 for 1735 cm-1,
1300 to 1150 cm-1 for 1235 cm-1,
and 2990 to 2870 cm-1 for 2920 cm-1.
4. Conclusion
For quantitative analysis on a solid sample using ATR, we have explained the importance of:
- contact area correction → use peak intensity ratio; and
- matching the contact status → match peak intensities during measurement
The peak intensity ratio reproducibility check for ethylene vinyl acetate copolymer described here used the peak near 2920 cm-1 as the correcting peak to determine the peak height ratio for the peaks near 1735 cm-1 and 1235 cm-1. However, the effects on the peak intensity ratio due to the differences in contact status increase as the distance from the peak position increase. Consequently, choosing a correction peak as near as possible to the target peak reduces the effects due to differences in contact status.