ABC's of Photoacoustic Spectroscopy
Photoacoustic spectroscopy (PAS) involves irradiating intermittent light onto a sample and then detecting the periodic temperature fluctuations in the sample as pressure fluctuations. Photoacoustic spectroscopy has only recently been applied in the infrared region. It is being applied in a diverse range of fields as FTIR becomes more widespread.
Features of photoacoustic spectroscopy:
(1)Permits measurements without pretreatment, regardless of sample form;
(2)Can even be used to measure optically-neutral samples that do not transmit or reflect incident light;
(3)Measurement sensitivity increases as the light source intensity increases;
(4)Obtains information at different depths by changing the velocity of the movable mirror in the interferometer.
These characteristics can be exploited to analyze irregularly shaped samples, perform measurement of the surface treatments on fabrics, films, and powders, and can be used for measurement in the depth direction.
(1) Principle of Photoacoustic Spectroscopy
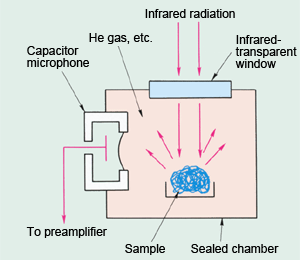
Fig. 1 Principle of Photoacoustic Spectroscopy
Photoacoustic spectroscopy measurement is based on the photoacoustic effect. The photoacoustic effect was discovered by Alexander Graham Bell in 1880. This is the phenomenon whereby, when intermittent light is irradiated onto a substance, the substance emits acoustic waves of the same frequency as the light pulse frequency. It took several decades from that time until the photoacoustic effect was subsequently applied as a measurement technique. With the development of highly-sensitive microphones and other advances in electronics, research progressed into the measurement of gas samples, in particular. The application of the photoacoustic effect in the infrared region is a new technique. With the development of highly-sensitive FTIR instruments, this technique is being widely researched for the analysis of solid samples.
The solid sample to be measured is placed in a sealed vessel to which small microphone is attached. Fig. 1 shows the measurement principle of FTIR photoacoustic spectroscopy. When a modulated infrared light beam is absorbed by the sample, heat is generated due to the incident light. This heat causes pressure changes in the surrounding gaseous layer, which can be detected by the high-sensitivity microphone. The signals from the microphone are acoustic interference waves. Applying Fourier transformation to these signals produces a spectrum similar to an absorption spectrum.
The theory of photoacoustic spectroscopy differs according to the sample form and photoacoustic cell construction. A theory that explains all situations has yet to be developed. RG theory based on thermal diffusion equations is a well-known theory for solid samples. It is summarized below. For more details, see Reference 1).
RG theory is based on the photoacoustic signal and three parameters; sample thickness l, light absorption length lß(where, lß = 1/ß and ß is the absorbance coefficient), and the thermal diffusion length µs(where, µs = 1/as and asis the thermal diffusion coefficient). It is classified according to whether the sample is optically transparent (lb > l) or opaque (lb < l), thermally thick (µs < l) or thermally thin (µs> l). For an optically transparent sample, the photoacoustic signal reflects the sample optical properties, regardless of the sample thermal properties. However, only when the sample is optically opaque and thermally thick (µs < lb)is the photoacoustic signal proportional to the sample absorbance coefficient and the thermal diffusion length.
In this case, although the sample is optically opaque, it is said to be photoacoustically transparent. Since the thermal diffusion length is a function of the modulation frequency of the incident light, increasing the modulation frequency and reducing the thermal diffusion length, such that (µs < lß), makes an optically opaque sample photoacoustically transparent. Also, as the photoacoustic signal is proportional to the thermal diffusion length for a thermally thick sample, the depth from which the photoacoustic signal is emitted can be changed by changing the modulation frequency. In other words, increasing the modulation frequency reduces the depth and the signal intensity. For a normal Michelson interferometer, the modulation frequency f is expressed as f = 2Vv. It is dependent on the velocity of the movable mirror V (cm/s) and the wavenumber v (cm-1). Therefore, f decreases as the movable mirror speed decreases. Conversely, as the thermal diffusion length increases, information is obtained from a deeper depth from the surface.
(2) Photoacoustic Cell
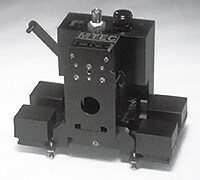
Fig. 2 PAS-300
Fig. 2 shows the appearance of the photoacoustic cell. The photoacoustic cell comprises a small, well-sealed vessel fitted with a highly sensitive microphone. Making the cell volume as small as possible increases the sensitivity. The cell is mounted on a vibration-isolation stand to eliminate vibrations from the floor that can generate noise.
(3) Examples of Measurements
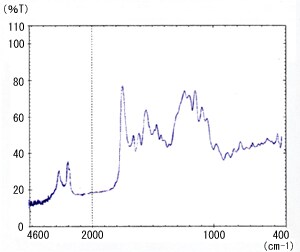
Fig. 3 PAS Spectrum for Sponge
Photoacoustic spectroscopy detects the light absorbed by the sample as sound waves. The signal is zero (0) for light that is not absorbed. Consequently, the peaks in a photoacoustic spectrum point upwards, opposite from a transmission spectrum.
Fig. 3 shows the measurement of sponge by photoacoustic spectroscopy.
Reference
- Tsuguo Sawada "Hikari Onkyou Bunkouhou to Sono Ouyou - PAS (Applications of Photoacoustic Spectroscopy - PAS)" p. 10, Japan Scientific Societies Press (1982)