Optimizing HPLC/UHPLC Systems
Diagnosing Chromatography Problems & Troubleshooting
Effects of Added Tubing
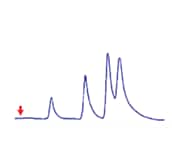
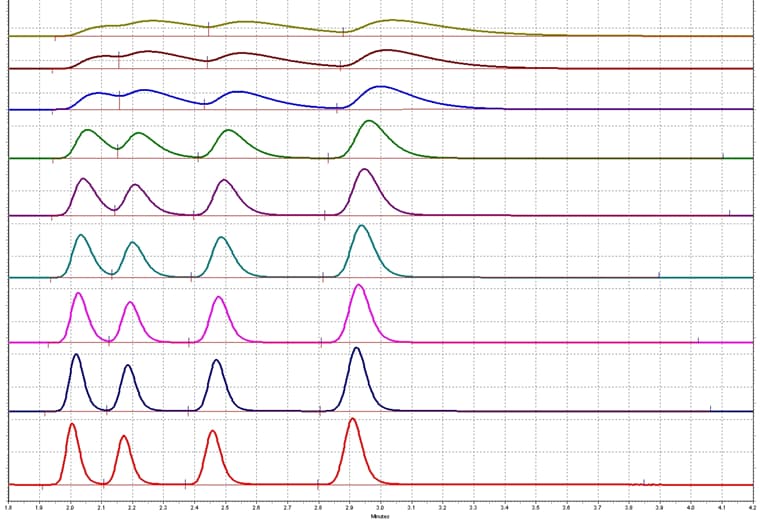
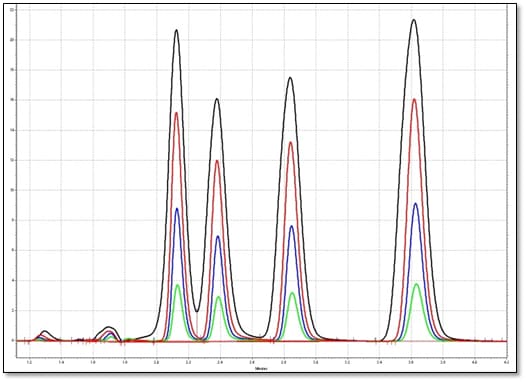
In our HPLC training, we are often asked “What is the effect of adding the tubing length before column on the chromatography in an isocratic run?”. As a result of using a longer tubing before the column, an increase in the retention time to the right occurs, as shown above. This increase in retention time is more obvious in the later peaks (from bottom to the top chromatograms). The reason is illustrated in the next graph.
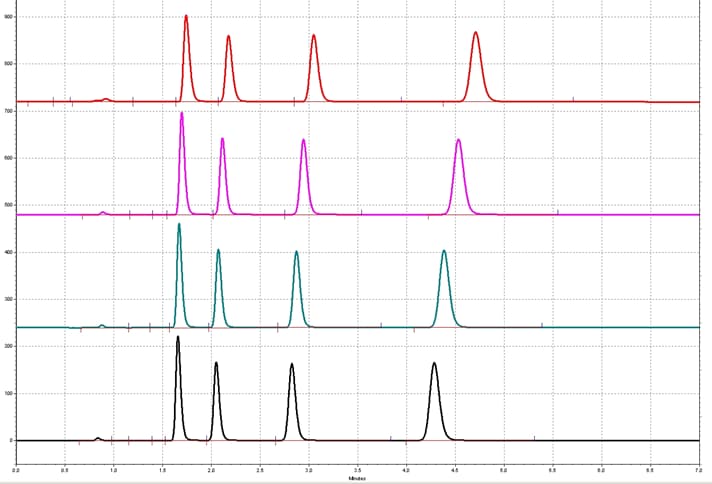
PARABEN TEST MIX, 4.6 mm ID Column, Isocratic Elution, 1. 5mL/min
Flow Dynamics and Injection
Upon injection, the analyte is a solid band. As the analyte band passes through the tubing, to get to the column, it changes to a parabolic laminar flow profile (due to drag on wall of tubing).
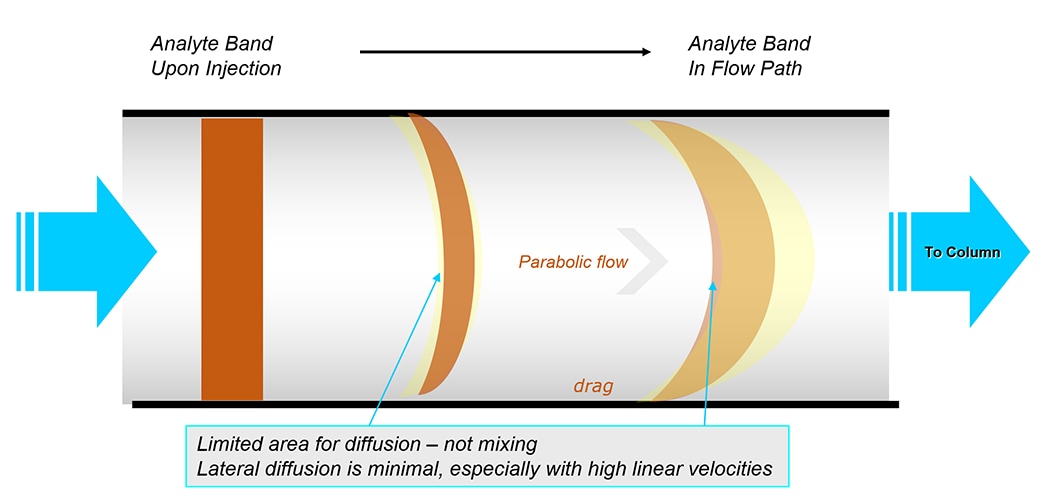
Band broadening increases as sample moves through tubing; more tubing, more broadening –called dispersion
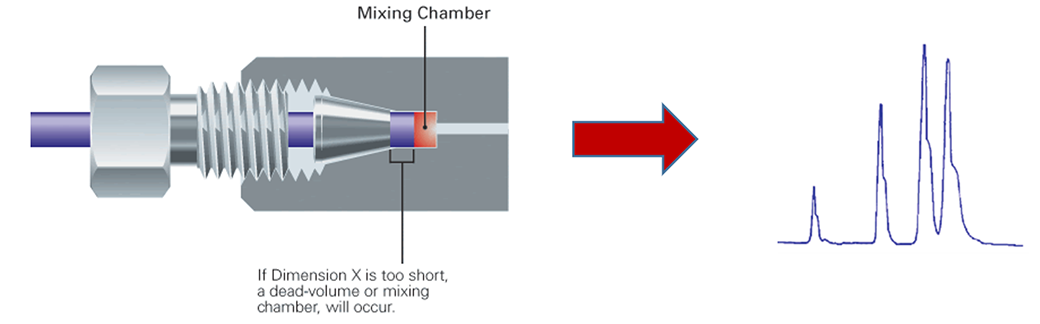
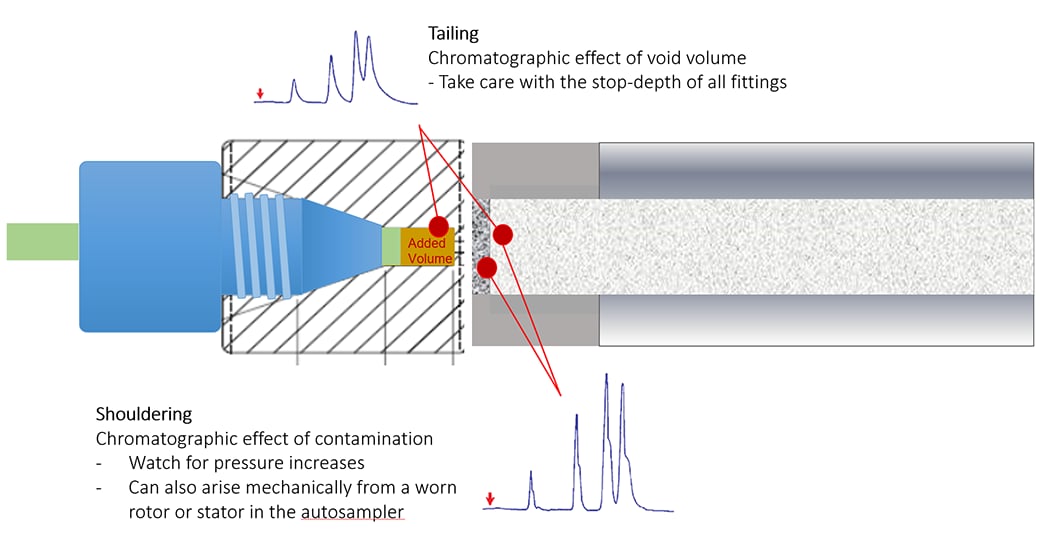
Effect of Void Volume
Poorly installed fittings at the column head can lead to loss in separation efficiency and leakage. When the installation depth of the tubing does not match the mounting depth of the column, a void volume can occur. More attention with the installation depth is needed when stainless steel tubing and fittings are used before the column. Note that fittings including male nuts and ferrules from different manufacturers might have different designs and should not be used mixed. As a consequence, the ferrule cannot seat properly and void volume (as shown in the image) or mixing chamber will form. Poor fitting need to be investigated from peak tailing. Make sure that the connections are tight but overtighten fittings will permanently damage the fitting and increase in system pressure. Shouldering, on the other hand, if is coincident with back pressure rise can be due to particulate contamination in the system.
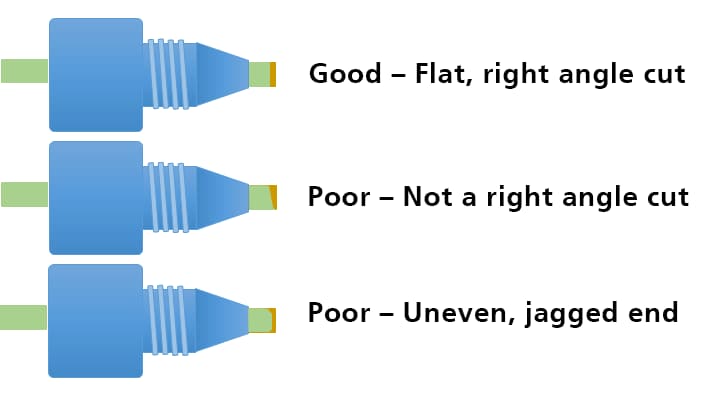
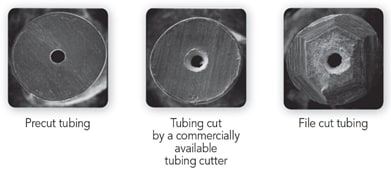
Cutting Tubing
A poor connection can also happen due to an improper tubing cut. Which will lead to formation of mixing chamber and consequently affects the chromatography. Usually stainless steel tubing is used before the column due to the pressure stability of this tubing. The image illustrates the proper planar surface of the cut for a manufacturer pre-cut tubing. The uneven nonplanar surface from a tubing cut by a commercial tube cutter, and the effects, are shown. The maximum issue with rising void volume, tailing and leakage will be seen with the file-cut tubing due to its extreme uneven nonplanar surface of the cut.
-
-
Tailing
A poor tubing cut can create a void, resulting in tailing. The effect is more pronounced with small-volume LC columns
Data Acquisition Rate
Let’s talk about the importance of data acquisition rate. The acquisition rate of a detector (for example, a UV-Vis or a PDA) is defined as the number of points taken over one second. The greater the number the more data point taken. The detector will take the point acquired within a set period of time and average them. The average data points are used to build the chromatogram. At least 10 data point across the peak will give a smooth symmetric gaussian peak shape. This is important for acceptable and reproducible chromatography.
We want to strive for at least 10 data points across a peak
Not enough points will result in jagged, unsmooth peaks and non-repeatable results
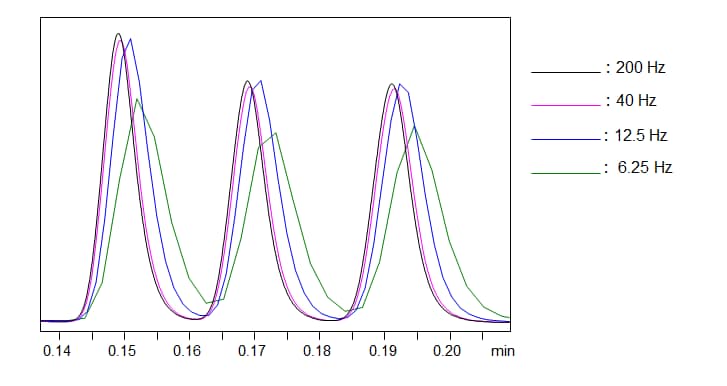
Time Constant (Response)
Short term detector noise can be improved by proper selection of the detector time constant. The time constant or the detector response is essentially the period of time over which the detector averages the signal. This example, shows the same chromatogram under different detector response (different time constant). Longer time constants damp noise more effectively but can also damp the peaks. It is important to find an optimum time constant that is effective at damping noise but not the peak shape.
Changing Flow Rate
An increase in the flow rate will elude the analyte faster. In an isocratic method, it decreases the retention time but the order of the elution maintains the same (isocratic run only).
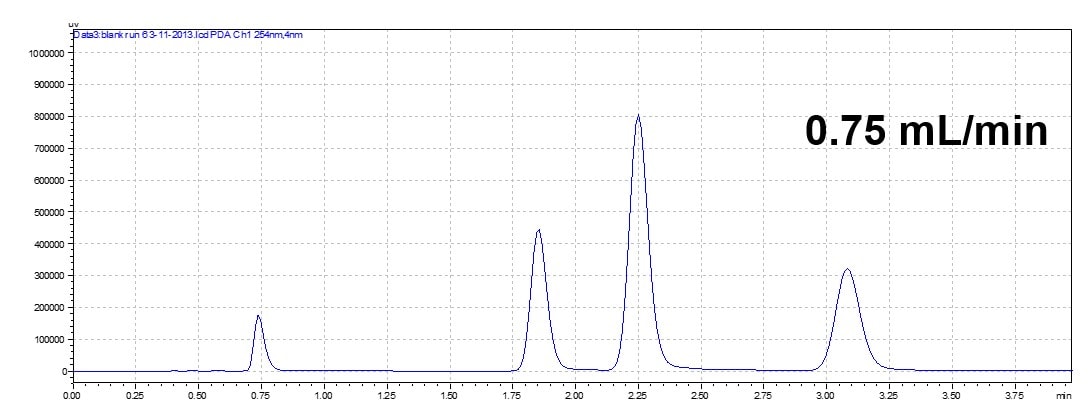
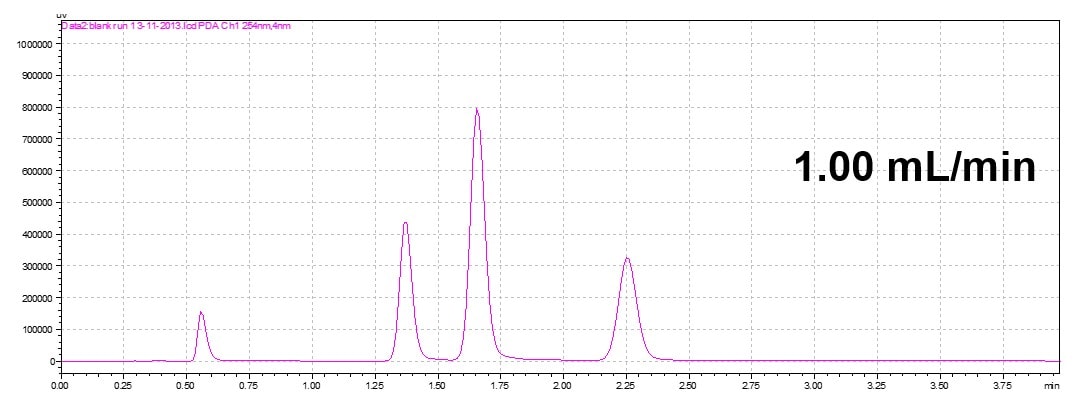
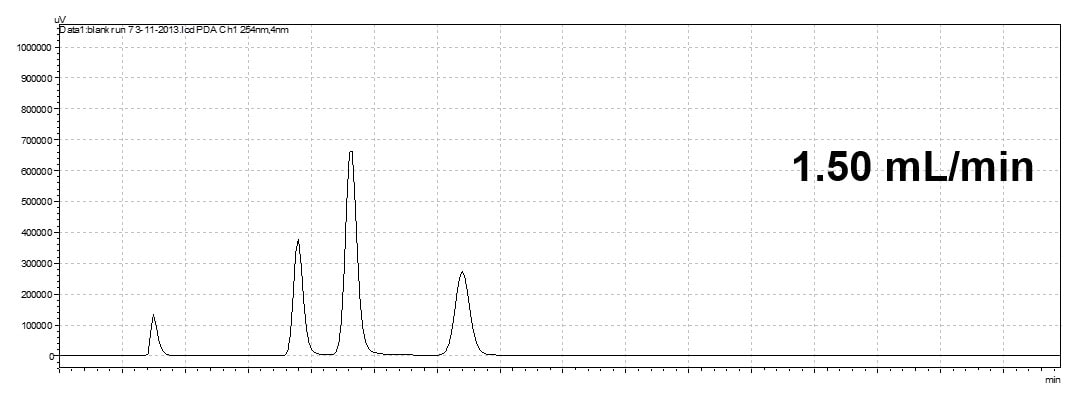
Flow rate will effect retention time and run time but will not change elution order of peaks
Varying Injection Volumes
This image shows how an increase in injection volume affects the peak area, width and height. Therefore, it is important to have a linear detector response for the selected range of injection volume.
- As injection volume increases, so does peak area, width and height
- Ideal to have a linear detector response as injection volume is varied
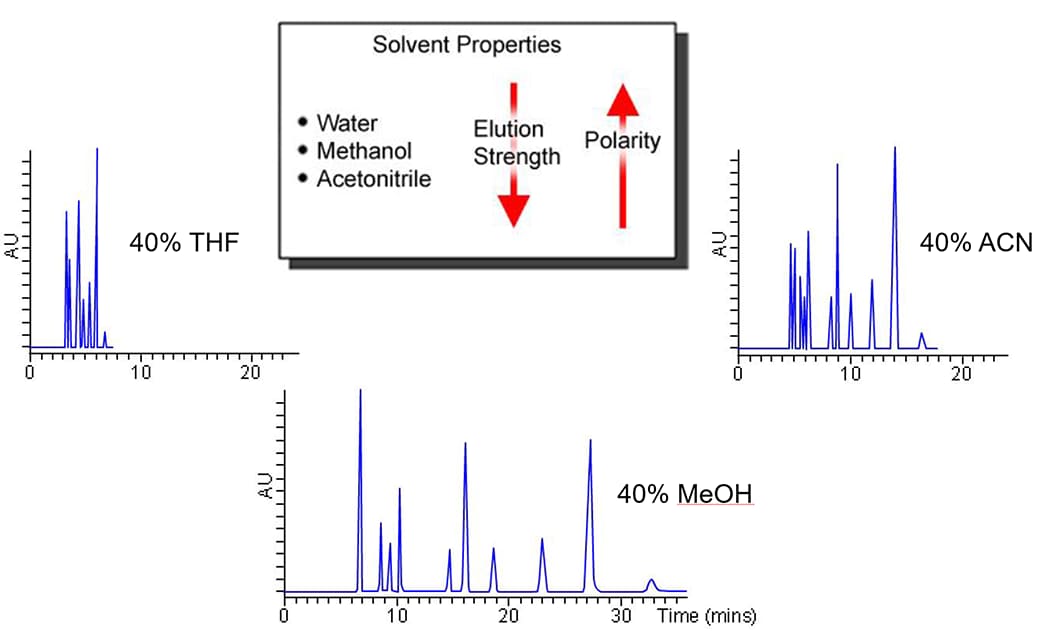
This image is representing the “elution strength” of a solvents for reversed-phase high-performance liquid chromatography. The elution strength is a measure of how well the solvent can "pull" an analyte off the column to which it is retained. Tetrahydrofuran (THF) has tendency to form the highly explosive peroxides, it is a stronger solvent compared to acetonitrile and methanol.
Varying Injection Solvents
Peak shape can be influenced by the injection solvent. It is better to dissolve the sample in initial mobile phase condition when possible. In this example, injection of samples in a strong solvent (acetonitrile) when a weak mobile phase (methanol/water) was used resulted in peak broadening. The peak broadening was much severe when an stronger solvent (IPA) was used.
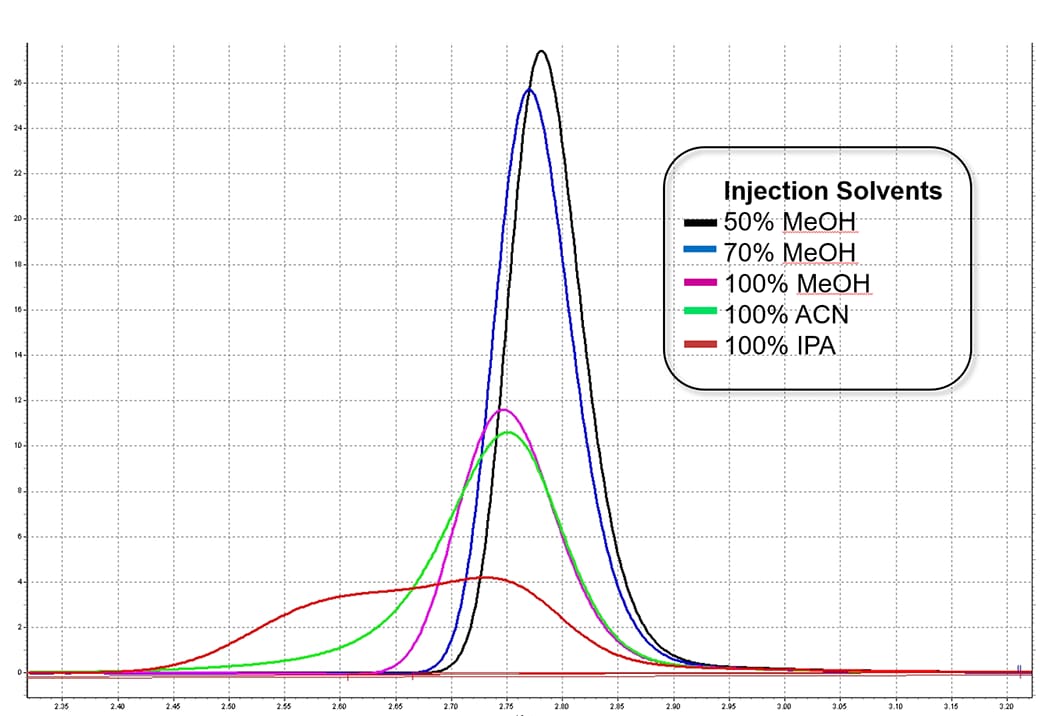
Eluent: 55/45 MeOH/Water
A flatter or more shallow gradient does increase the average resolution, the sum of all resolutions increases. With a shorter gradient the peaks elude earlier, but the peaks area is narrower. A steep gradient lowers the detection limit. A flat gradient often leads to an improvement in resolution in later part of the chromatogram (as shown in this image). Long gradients often lead to better resolution only for the late eluding peaks. Keep in mind that an isocratic step at the beginning can but not always improves the resolution. Please note that the initial %B is important for the “front” peaks and final %B for the “end” peaks. Thus to achieve a successful gradient run use a reasonable starting %B and initially vary only the slope as needed.
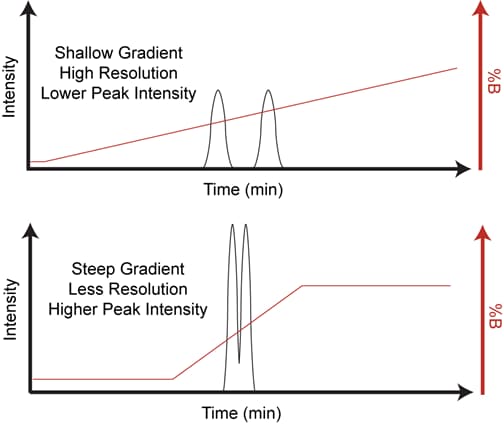
Rate of change of organic/time is less in first example therefore less drive to pull analyte from column. Slope is greater in second example there analyte pulled off faster
This image shows the separation acceleration via temperature increase. The retention drops going from the lowest to the highest temperature. Note that the peaks appear much sharper at the elevated temperature. The theory is described by the kinetics of the chromatography and by the van Deemter theory. An increase in temperature facilitates the diffusion which is important to achieve a good peak efficiency. As a rule of thumb, for an isocratic run, retention will change 1-2% for each degree (°C) change in temperature.
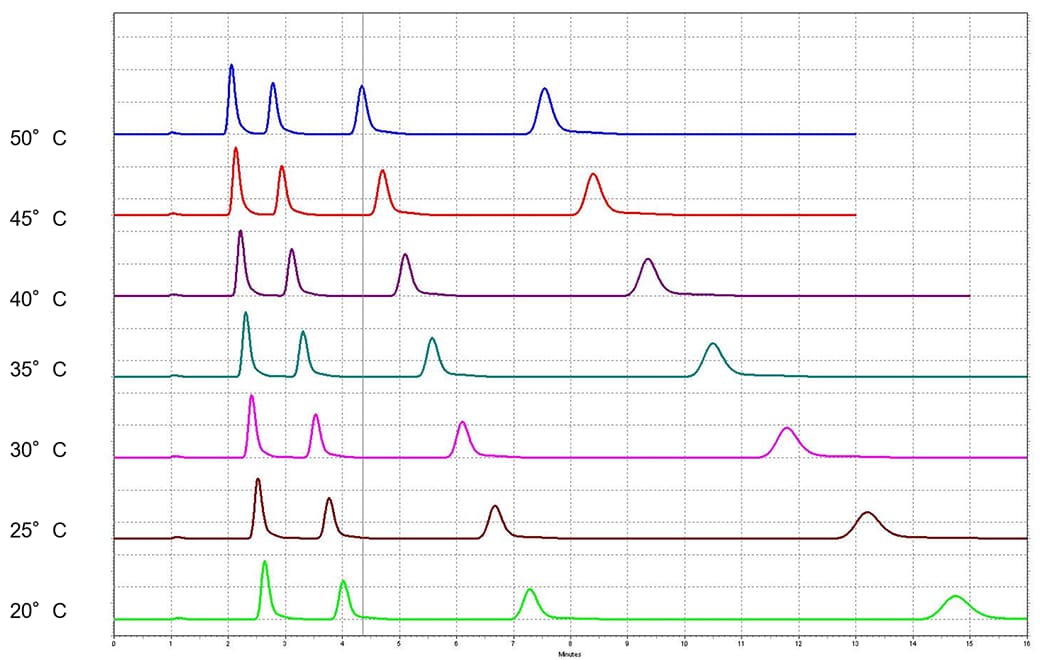
2.1 mm ID Column, 0.35 mL/min, 50/50 MeOH/Water
Rules for Troubleshooting
5 Key Points for Troubleshooting
- Rule of One (KISS Method) - change or modify only one item at a time
- Rule of Two - A "problem" doesn't exist until it occurs at least twice
- Put it back - If you change a part and it does not resolve the problem, but the original part back
- Throw it away - If a part is expired or broken - dispose of it.
- Write it down - Every system should have a notebook for logging any service and/or maintenance action.
John W. Dolan, a contributing editor for LC-GC Magazine, (LC-GC 6, 304 -308, 1988)
My peak height is decreasing but my area and retention time are the same
Likely culprit: Column
- Rinse column per manufacturer's instructions. If chromatography continues to degrade, replace column.
- If you find that you have to continually replace columns every few months, re-evaluate your method. You may need to incorporate a sample clean-up step or install a guard column.
My retention time is shifting* higher/lower but the area is the same

Likely Culprit: Pump
Decreasing retention time: faulty aqueous pump (Pump A)
- Purge pump and attempt to clean check valves.
- Consumables likely need to be replaced on aqueous pump.
- Check for leaks and perform PM.
*Run to run RT variation of ±0.02-0.05 min is normal however the behavior of the method should be used to determine what is a normal variation.
Increasing RT: faulty organic pump (Pump B)
- Purge pump and attempt to clean check valves.
- Consumables likely need to be replaced on organic pump.
- Check for leaks and perform PM.
If using an FCV or LPGE, make sure all mobile phase lines are primed (even the ones you are not using).
My peak area and height are changing
Likely culprit: Autosampler
Make sure your rinse phase is degassed.
- Prime and purge metering pump to remove any air bubbles.
- Allow to run for the default time of 25 min.
An extra peak is showing up in my chromatogram
Likely culprit: Autosampler or Column
- Perform blank injections.
Is extra peek wider than its neighbors?
- If so, extra peak could be late-eluter from previous run.
- Adjust method parameters to make sure all peaks are eluted off column during run.
- Adjust needle rinse parameters.
- Perform injection port teaching.
If extra peak area remains the same after several blank injections, contamination is inside needle/sample loop.
- Attempt to rinse flow line.
- Adjust internal needle rinsing parameters (if possible).
- Replace parts as necessary.
I have a jagged baseline
Likely culprit: n/a
- Common causes of a jagged baseline are temperature fluctuations, dissolved air in mobile phase, dirty flow cell and insufficient mobile phase mixing.
Surprise! Troubleshooting Tip - I Have Peak Splitting
Likely culprit: Tubing, Fittings, and Connections
- All peaks have splitting:
- Check all tubing connections, as there is probably a void in tubing connections.
- The autosampler rotor may be scratched, resulting in a “muddied” injection event.
- One peak has splitting:
- Go over method development, likely you do not have adequate separation of components.