Learn More About Intelligent Peak Deconvolution – i-PDeA II
UV vs Diode-Array (PDA) Detectors for (U)HPLC
Liquid chromatography systems feature detectors chosen according to the chemistry of the analytes of interest to the user. The vast majority of detectors for (U)HPLC are light absorbing detectors which focus on ultraviolet (UV) and visible (Vis) regions of the spectrum in the 190 - 900 nanometer (nm) wavelength range and are often abbreviated UV-Vis or UV/Vis. Most analyses of organic analytes are in the ultraviolet range 190 - 350 nm. The HPLC/UV generally only measures a couple of user-selectable specific wavelengths simultaneously. For natural products analyses, it is common to monitor 220 nm and 274 nm to determine analytes of interest. So, confirmation of the specific analyte is based on its retention time in the chromatography.
-
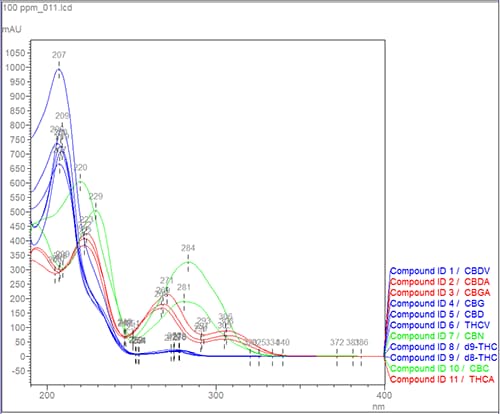
Figure 1: Example of cannabinoids measured by (U)HPLC with Diode-Array detection.
-
The photo diode array (PDA), also known as the diode array detector (DAD) can measure the entire wavelength range in real time, which may provide other advantages. Figure 1 provides an example from the analysis of cannabinoids by spectral absorbance profile which can be utilized as a second form of analyte confirmation. Notice the neutral cannabinoids (delta-9-THC, delta-8-THC, THCV, CBD, CBDV, and CBG) in the blue traces have a similar spectral profile that differ from the acidic forms (THCA, CBDA, and CGBA) shown in the red traces. The acidic cannabinoids have a carboxylic acid functional group (-COOH) providing lower energy, higher wavenumber absorbance maxima. Thus, PDA may be useful in discerning between analytes with dissimilar absorbance spectra. In our example, PDA could be used to distinguish the neutral cannabinoids for the acidic forms but should not be used to confirm cannabinoids within the same class.
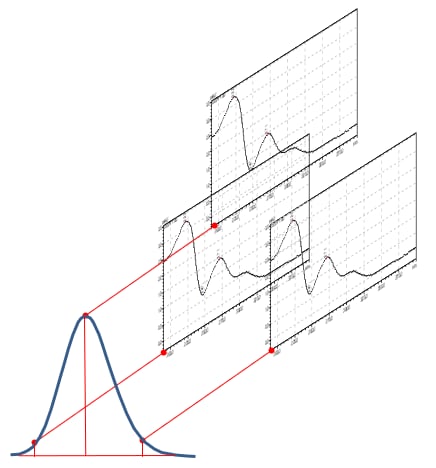
Figure 2: Simplified schematic of Peak Purity measurement across the peak and comparing with the spectral absorbance
PDA has other advantages in that the spectral profile may assist in determining an unknown peak in the chromatograms. For full confirmation, analyses should be performed by mass spectrometry. In the pharmaceutical industry the PDA is often used to determine peak purity of the target compound. The absorbance spectra are compared at multiple points across the peak for similarities and differences shown in Figure 2. Software does the heavy lifting, a peak purity index is generated which may indicate whether multiple compounds may be co-eluting.
The novel i-PDeA function
Shimadzu offers a powerful expansion to the spectral abilities of diode array detection. The i-PDeA function provides peak deconvolution (virtual separation of chromatographically unresolved peaks). Since the PDA detector collects both time information (the chromatogram) as well as spectral information (UV spectrum), Figure 3, it is possible to deconvolute the data and determine the quantity of each analyte in a co-eluting peak. The technique is simple in use, and powerful in its ability to create quantitative results from virtual peak separations. The i-PDeA deconvolution relies on sound scientific principles, not estimation based on gaussian modeling that has been used in the past.
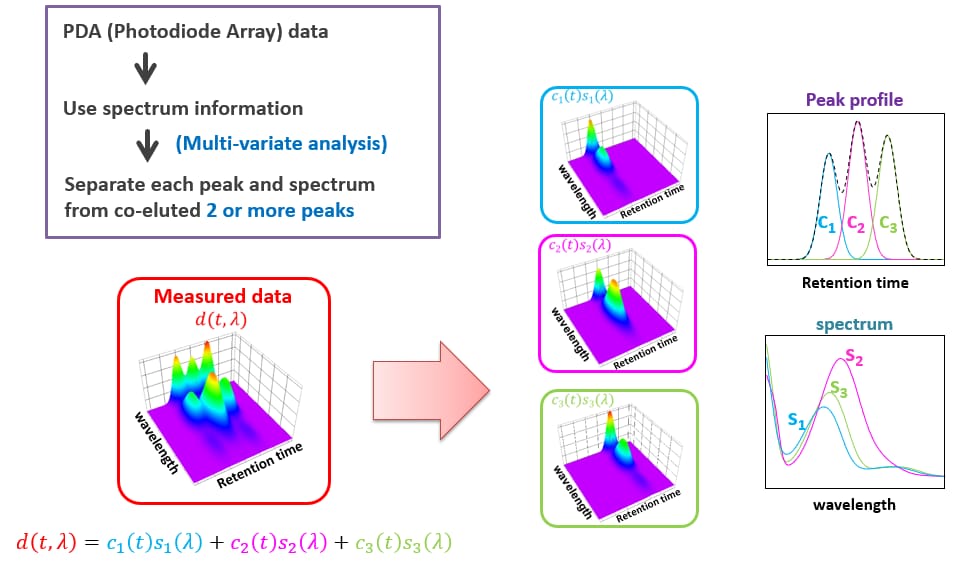
Figure 3: i-PDeA deconvolution of co-eluting peaks utilizing time information (the chromatogram) as well as spectral information (UV spectrum)
