This article was published in J. Chrom A, 1469, Arase, et.al., 35-47, Copyright Elsevier (2016).
Intelligent Peak Deconvolution Analysis (i-PDeA) is a data analysis technique that extracts a single peak from co-eluted peaks and quantitates it by exploiting the differences in spectra between each compound.
i-PDeA II enables users to visualize and detect a minor single impurity even when the impurity is co-eluted with an analyte. It also facilitates the separation of hard-to-separate peaks on the column through computer processing and deconvolution of the spectrum information, which reduces the effort required to investigate separation parameters.
The following highlights some benefits of i-PDeA II through application examples.
This article was published in J. Chrom A, 1469, Arase, et.al., 35-47, Copyright Elsevier (2016).
・When you apply i-PDeA, you can selectively visualize only the components you want to view, even peaks that are not separated!
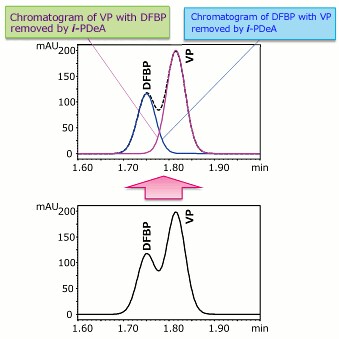
Using i-PDeA, the VP and DFBP Peaks Can Be Separated! (DFBP: Difluorobenzophenone, VP: Valerophenone)
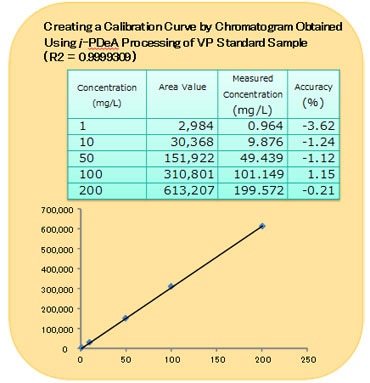
A Calibration Curve Created Using i-PDeA for the VP Standard Sample
・With i-PDeA, no additional consideration of separation conditions is required! Quantitative calculation can be done directly!
These materials were provided by Mr. Kanta Horie, Global Formulation Research, Pharmaceutical Science & Technology, Eisai Co., Ltd.
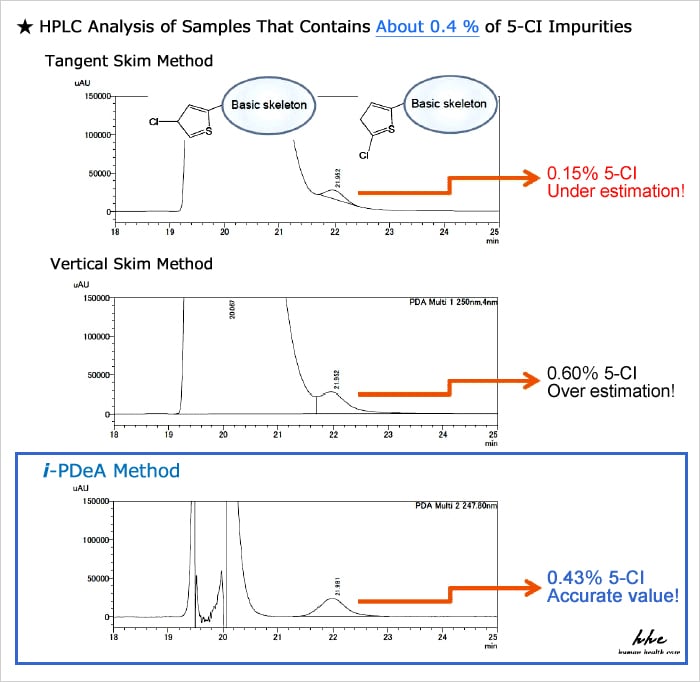
Compared to existing peak integration methods such as tailing (tangent skim method) and vertical separation (vertical skim method), i-PDeA permits quantitative calculation of impurities with higher precision!
・Achieve separation using i-PDeA even though the spectral patterns are similar
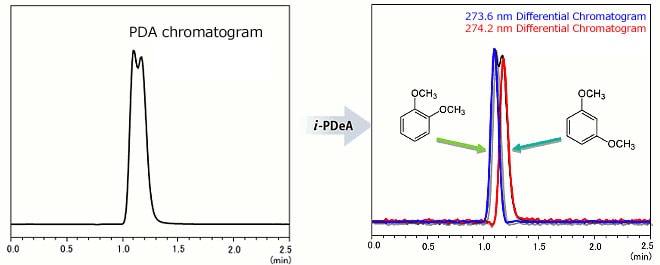
Separation of 1,2-Dimethoxybenzene (274.2 nm wavelength) and 1,3-Dimethoxybenzene (273.6 nm)
Even though the difference in absorption wavelength between 1,2-dimethoxybenzene (274.2 nm wavelength) and 1,3-dimethoxybenzene (273.6 nm) is only 0.6 nm, the individual chromatograms can be obtained!
Impurity Detection and Faster Peak Separation for PDA Detectors
Lab analysts in many industries need to quickly identify contaminants and impurities in raw materials and finished products. Shimadzu's i-PDeA data processing method analyzes and detects unseparated peaks and small peaks concealed in the main component. It reduces the time required for considering separation conditions and plays a complementary role in quantitative analysis.
Achieve Better Resolution with Intelligent Peak Deconvolution Analysis (i-PDeA)
Intelligent Peak Deconvolution Analysis (i-PDeA) is a groundbreaking technology, which ensures accurate quantitation even for co-eluted compounds by utilizing spectral differences between each compound, setting a new standard in peak analysis. By using the iPDeA function of LabSolutions, you can accurately quantify your co-eluting compounds and impurities, without spending weeks on achieving chromatographic resolution.
Shimadzu’s New Nexera X4 UHPLC Achieves Unmatched Sensitivity, Exceptional Separation Performance and Reliable High-Speed Analysis
Shimadzu Scientific Instruments introduces the Nexera X4 Ultra High-Performance Liquid Chromatograph (UHPLC), a next-generation system that builds on the proven technology of Shimadzu’s Nexera series. With its industry-leading low-dispersion design, the Nexera X4 UHPLC delivers superior sensitivity, ultra-sharp peaks and outstanding separation performance. Advanced fluid control technology maintains exceptional flow stability during high-speed, ultra-high-pressure analyses for consistently reliable results. The system is ideal for research and development applications in pharmaceuticals, food, environmental science and chemistry.
Shimadzu Scientific Instruments Inc. Opens New Laboratory in the San Francisco Bay Area -Accelerating New Product and Business Development for the Pharmaceutical and Life Science Fields
Shimadzu Corporation has positioned North America as a strategic focus area and is committed to expanding its business. Through this South San Francisco Lab, the company aims to position itself as a market leader by delivering unique, next-generation solutions that contribute to the advancement of the industry.
Shimadzu Introduces the User-Friendly Nexera IC Ion Chromatograph for Water Quality Testing
Shimadzu Scientific Instruments introduces the Nexera Ion Chromatograph (IC), a compact, fully automated system designed to streamline water quality testing while delivering accurate, reliable results for users of all experience levels. Engineered for both routine and regulated samples, the Nexera IC combines advanced automation, intuitive software and a space-saving design to reduce manual effort and maintain consistent analytical performance.