What are the different data collection modes of a typical spectrophotometer?
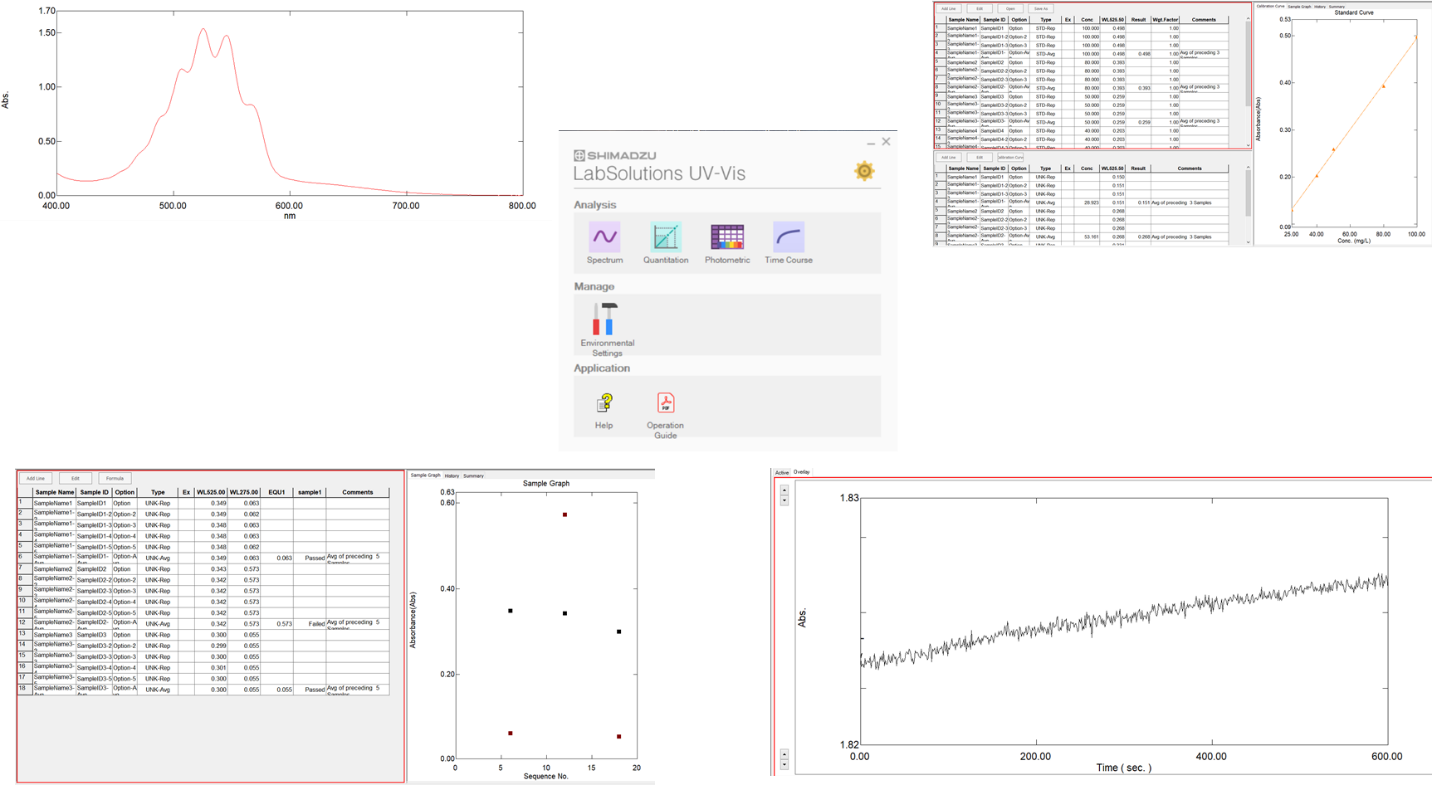
There are four common modes of data collection on a typical UV/Vis/NIR spectrophotometer. Below is the main menu for Shimadzu’s instruments.
1) Scan Mode - The most commonly used mode is wavelength scanning. Here the wavelength is scanned while the ordinate value is recorded to produce a spectrum as seen above. Instruments scan from longest wavelength to shortest. This is to reduce the sample’s exposure to high energy UV light which could cause photo-decomposition.
2) Quant Mode - Quantization is usually performed on a major peak of the sample. Data can be collected as either peak height or area. Beer’s law states that the sample absorbance is directly proportional to concentration. Standards are measured first and can consist of either one or many different concentrations. Concentrations of the standard are then analyzed and graphed using a least squares statistical analysis (seen above). Unknown samples can be calculated from the line fitting equation. If only a single standard is used, linearity is assumed.
3) Photometric Mode - Sometimes a wavelength scan is not required, but multiple discontinuous wavelength data needs to be collected. Photometric mode allows for a table of wavelengths to be defined and collected. This process is usually performed to save time since this function is quicker than a wavelength scan.
4) Time Drive Mode - This mode collects ordinate data from a fixed wavelength as a function of time. Frequently used for kinetic analysis to investigate samples changes over time.