ATR Precautions
Molecular Spectroscopy
The ATR technique (attenuated total reflection and internal reflection) is attractive to a wide range of application (e.g., films, rubber, polymers and liquid samples) because sample pretreatment is unnecessary to obtain information from the surface of the sample. This advantage was further utilized through the incorporation of the ATR objective lens in a microscope and the single-reflection ATR measurement accessory in the bench-top FTIR. These advancements have made it possible to obtain measurements with minimal operator effort and with good sensitivity for minute samples in microscopic regions, those with rough surfaces where adhesion to the prism would be detrimental, curved samples, and powdery samples.
The effects, of the ATR technique, on a sample spectrum are well characterized. For example, the depth of penetration is inversely proportional to increasing wavelength. Therefore, the peak intensity generally decreases as one proceeds from the low wavelength to the high wavelength side of a spectrum. In samples that possess a high refractive index one may observe peak distortion, skewed baselines, and shifts in both the peak positions and the peak intensity in the spectrum.
1.Partial peak shifts due to types of prisms
It is well known that the ATR spectra of samples with high refractive indices show peak distortion and peak shift to lower wavenumber side compared to transmission spectra. However, the same sort of phenomenon also occurs to some extent in the ATR spectra of substances that have a refractive index of approximately 1.5 (e.g., resins).
Figures 1 & 2 show the results of measurements of PET (poly(ethylene terephthalate)) films with the MIRacle single-reflection ATR accessory. The measurements were where taken with both ZnSe (refractive index = 2.4, Fig. 1) and Ge (refractive index = 4.0, Fig. 2) prisms using a resolution of 2 cm-1 and 40 scans.
While comparing the two spectra, the relatively small peaks at 1505.51, 1340.58, and 871.86 cm-1 are consistent. However, there is clearly differences in the large peaks in the vicinity of 1712, 1244, and 1096 cm-1. This is a result of the ZnSe prism shifting the peaks toward the low wavenumber side. In addition, the positions of the peaks at 724.30 cm-1 overlap in wavenumber but clearly possess different widths.
The change in width is attributed to the change in refractive index as a function of wavenumbers. The changes are more prominent in the case of strong absorption. So the opposite is also true. In cases where the prisms used have a relatively small refractive index (e.g., ZnSe and diamond (refrective index) = 2.4) this effect is less evident. As an example, we compare results obtained with a ZnSe prism to that obtained with a Ge prism (refractive index = 4.0).
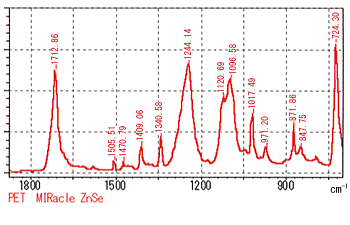
Figure 1 ATR Spectrum of PET (prism: ZnSe)
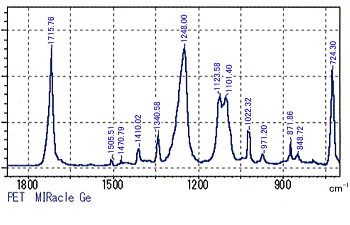
Figure 2 ATR Spectrum of PET (prism: Ge)
2.Effect of physical changes in the sample as a result of pressure
When using the ATR technique to measure solid samples, it is necessary to press the sample against the prism. If there is any change in the physical state of the sample due to pressure, these changes will be manifested in spectrum obtained. Fig. 3 presents the spectra of low density polyethylene collected on a DuraSampl-IR single-reflection ATR, at three different pressures.
It is clear from Fig. 3 that the peak in the vicinity of 1472 cm-1 increases as pressure is increased. In contrast, the peak in the vicinity of 1462 cm-1 decreases as the pressure is increased. Despite these subtle differences, we can conclude that there is no substantial difference occurring in the area between the prism and the sample as a function of pressure.
Both peaks are assigned to CH2 scissor vibrations, but the peak in the vicinity of 1472 cm-1 is attributed to crystalline regions in the sample. Pressing the sample against the prism with strong pressure has been shown to cause changes in the sample’s properties such as its crystallinity.
During ATR measurements, tight adhesion is necessary between the sample and the prism in the ATR. But one most always keep in mind that the sample measurement is affected by this act of “pressing” and realize that this effect can result in minute differences and changes between samples.
3.Conclusion
The previous discussion serves as an introduction to the effects of refractive index, wavenumber, and differences in pressure on a spectrum. The next installment, “ATR Precautions - No. 2”, will serve as an introduction to the effect of sample adhesion between the sample and the prism on a spectrum.