ABC's of the Diffuse Reflection Method
Infrared spectroscopy can be used to analyze solid, liquid, or gas samples. Here, we discuss the measurement of solids, particularly powder samples, by the diffuse reflection method.
Previously, the KBr pellet method was used for powder sample analysis. This involves mixing the sample with KBr powder, forming it into a pellet, and measuring the infrared spectrum. It is the basic measurement method for powder samples. However, as FTIR has become more common, the diffuse reflection method has become widely used. The reason for the popularity of this method is the much easier pretreatment than the KBr pellet method. Since the diffuse reflection method offers more information about substances adhering to the sample surface than transmission methods and also permits vacuum heating measurements, it is widely used in the field of catalysts.
1) Principle of the Diffuse Reflection Method
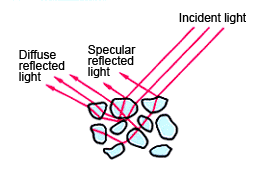
Fig. 1 Schematic Diagram of Light Scattering from a Powder Sample
When light shines onto a powder sample, it is reflected in all directions, as shown in Fig. 1. Some of the light undergoes specular reflection at the powder surface. Due to the variety of powder shapes, it is reflected in many directions, unlike light reflected from a mirror. The remainder of the light is refracted as it enters the powder, where it is scattered due to internal reflection, reflection from the surfaces of other powder grains, or repeated refraction entry into the powder. Some of this scattered light is emitted back into the air.
As the diffuse reflected light is reflected or passes through the powder, it becomes weaker if absorption by the powder occurs. This results in a diffuse reflected spectrum, similar to the transmission spectrum. However, in regions where the powder exhibits strong absorption, most of the diffuse reflected light in long light paths is absorbed, such that only the diffuse reflected light from short light paths is emitted back into the air. Conversely, in bands of weak absorption, some light is not absorbed even in long light paths and this diffuse reflected light is emitted to the air, resulting in stronger peaks than the transmission spectrum. In such a diffuse reflectance spectrum, the absorbed wavenumber positions are the same as the transmission spectrum. However, the relative intensity between peaks differs from the transmission spectrum because the weak peaks in the transmission spectrum become comparatively stronger in the diffuse reflectance spectrum. The so-called K-M function (f(R∞)) derived by Kubelka-Munk is used for comparison to transmission spectra or quantitative analysis.
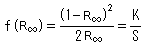
Where, R∞ is the absolute reflectance, K is the absorption coefficient, and S is the scattering coefficient. However, due to the difficulty in measuring the absolute reflectance R∞, in practice, the comparative reflectance r∞ with respect to a standard powder such as KBr or KCl, of which K is near zero (0) in the actual measurement range,

Light emitted into the air from the powder contains specular reflection light, as well as diffuse reflected light. The specular reflection light must be reduced to obtain a more accurate diffuse reflectance spectrum. To achieve this, the particle size must be reduced. Reducing the particle size to a size equivalent to the wavelength is said to decrease the proportion of specular reflection light and maximize the scattering efficiency. The particle shape and packing status are other important factors, in addition to the particle size.
Samples are normally not measured directly but in a form diluted to a suitable concentration (1 % to 10 %) in a KBr or KCl standard powder.
(2) Diffuse Reflectance Accessory
Fig. 2 shows the appearance of the DRS-8000 diffuse reflectance accessory. Fig. 3 shows the optical system. M3 shines infrared light on the sample. M4 collects the diffuse reflected light, which passes via M5 and M6 to the detector. The sample plate is 6 mm in diameter and 1.5 mm in depth.
Highly sensitive measurements on a small volume of sample can be made by filling the sample plate with KBr powder and putting the sample powder mixed with a small quantity of KBr powder onto it.
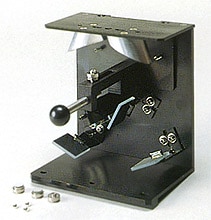
Fig. 2 Appearance of the DRS-8000 Diffuse Reflectance Accessory
Fig. 3 DRS-8000 Diffuse Reflectance Accessory Optical System
(3) Sample Measurements
Fig. 4 shows the diffuse reflectance spectrum (green) for caffeine. Fig. 5 shows the spectrum (red) after Kubelka - Munk formation. The diffuse reflectance spectrum exhibits the weak peaks comparatively clearly. However, after transformation, the intensity of these peaks decreases and the relative intensity between peaks become analogous to a transmission spectrum.
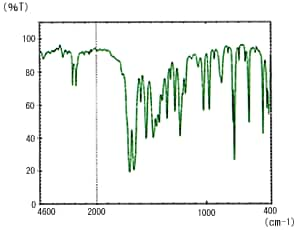
Fig. 4 Diffuse Reflectance Spectrum of Caffeine
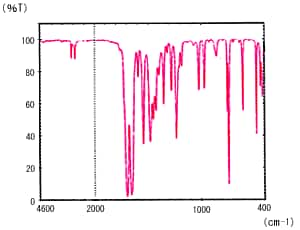
Fig. 5 Diffuse Reflectance Spectrum of Caffeine after K-M Conversion