ABC's of the Specular Reflection Method and Kramer's-Koenig Analysis
Light that reflects back at the same angle as the angle of incidence is known as "specular reflection light." The FTIR method that exploits specular reflection light is called the "specular reflection method." When using the specular reflection method, the sample can be irradiated with infrared light from an almost vertical angle of incidence or an almost horizontal angle of incidence. A specular reflection accessory that irradiates the sample with infrared light from an almost vertical angle is used to measure the infrared spectra of comparatively thick, µm-order, metal coatings or to measure the film thickness on epitaxial wafers using interference fringes.
However, when a specular reflection spectrum is measured for shiny samples that exhibit absorption in the infrared range, such as plastic, glass, or crystal, the peaks are deformed toward the first-order differential form due to the anomalous dispersion of the refractive index in a range where absorption occurs. Qualification or functional group analysis is difficult from such a spectrum. Therefore, the deformed spectrum must be converted to a normal absorption spectrum using so-called Kramer's-Koenig transformation.
(1) Kramer's-Koenig Analysis
The explanation below applies to the irradiation of substance at an almost vertical angle of incidence. A more detailed explanation is given in the References 1), 2) below. The complex index of refraction of the substance n* is set as follows:
n*= n + ik (where n and k are the refractive index and absorbance coefficient of the substance, respectively)
Then, the amplitude reflectance (r) under vertical irradiation and energy reflectance (R) determined directly from the specular reflection spectrum are expressed by the following equations:
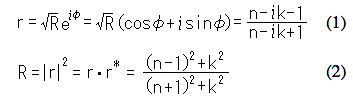
Where, φ is the phase change. This results because both reflection and absorption occur at the sample surface. r* is the complex conjugate of r.
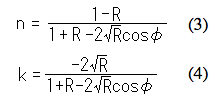
Dividing Equation (1) into real and imaginary parts and solving for n and k yields the following equations:
Taking the logarithm of Equation (1), gives
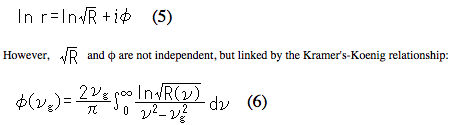
If the energy reflectance is measured across the entire wavenumber range, the phase change φ(νg) can be calculated at any required wavenumber νg using this relational expression, and then the optical constants n and k can be determined from Equations (3) and (4). Consequently, by calculating k at constant wavenumber intervals across the normal infrared range between 4600 and 400 cm-1 for example, an absorbance coefficient spectrum equivalent to the transmission spectrum can be calculated from the specular reflection spectrum.
In the integration of Equation (6), a pole exists at ν = νg but several methods have been proposed to handle this integration. Two typical methods are the Maclaurin method and the double Fourier transform method. In the Maclaurin method, the phase change φ(νg) is given by Equation (7)
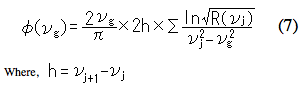
j = 2, 4, 6, ........., g-1, g+1, ......... (if g is an odd number)
j = 1, 3, 5, ........., g-1, g+1, ......... (if g is an even number)
The νj start point is set so that ν = νg does not occur and alternate data points are used. With the double Fourier transform method, φ(νg) is determined by Equation (8), a double Fourier transformation which is an approximation of Equation (6).

The Maclaurin method provides better calculation accuracy, but because it is so time-consuming, the quicker double Fourier transformation method is normally used.
(2) Specular Reflectance Accessory
Fig. 1 shows the appearance of the SRM-8000 specular reflection accessory. Fig. 2 shows the optical system. Light reflected from plane mirrors M1 and M2 reflects from the spherical mirror M3 and forms an image on the sample surface. The light beam has a mean 10-degree angle of incidence with respect to the sample. Light reflected from the sample reflects from spherical mirror M4 and plane mirrors M5 and M6 onto the detector in the FTIR instrument.
The normal references are aluminum and gold vapor-deposited mirror.
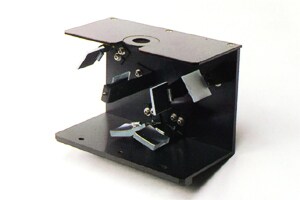
Fig. 1 Appearance of the SRM-8000 Specular Reflection Accessory
Fig. 2 SRM-8000 Specular Reflection Accessory Optical System
(3) Examples of Measurements
Fig. 3 shows the specular reflection spectrum for acrylic sheet. It exhibits absorption up to 2000 cm-1 but the peaks are deformed toward the first-order differential form due to the anomalous dispersion of the refractive index. Fig. 4 shows the spectrum in Fig. 3 after Kramer's-Koenig transformation. This spectrum indicates that the sample is polymethyl methacrylate (PMMA).
Fig. 3 Specular Reflection Spectrum for Polymethyl Methacrylate (PMMA)
Fig. 4 Specular Reflection Spectrum for Polymethyl Methacrylate (PMMA) after Kramer's-Koenig Transformation
|
Reference
|