Fourier Transform and Apodization
Interferograms
When analyzing a sample by a Fourier transform infrared (FTIR) spectrophotometer, the measurement mode is normally set to transmittance or absorbance. However, unlike a dispersive spectrophotometer, the FTIR instrument does not measure these spectra directly.
In FTIR analyses, Infrared light from the light source passes through a Michelson interferometer along the optical path.
The Michelson interferometer comprises a beam splitter, moving mirror, and fixed mirror. The light beam split into two by the beam splitter is reflected from the moving mirror and fixed mirror, before being recombined by the beam splitter.
As the moving mirror makes reciprocating movements, the optical path difference to the fixed mirror changes, such that the phase difference changes with time. The light beams are recombined in the Michelson interferometer to produce interference light. The intensity of the interference light is recorded in an interferogram, with the optical path difference recorded along the horizontal axis.
The data directly acquired by the FTIR instrument is in the form of an interferogram of the infrared light that passed through the sample. Looking at the interferogram does not give an understanding of the sample characteristics. To get a normal spectrum with the wavenumber (wavelength) along the horizontal axis requires Fourier transform by a computer. This is the major characteristic of the FTIR instrument and differentiates it from a dispersive spectrophotometer, which measures spectra directly.
Principle of Fourier Transform Spectrophotometry
The final data required from sample measurements has the wavenumber along the horizontal axis, as described above.
A spectrum shows the light separated into its component wavelengths and the intensity plotted at each wavelength.
This separation process is called "spectroscopy."
When the infrared light at wavelength λ enters the Michelson interferometer, if the optical path difference is an integer multiple, the peaks and valleys uperimpose, increasing the light intensity. Conversely, when the optical path difference is a half-integer multiple (integer + 1/2), the light becomes weaker. If the original light intensity is denoted asP(λ), the intensityI(x) at the optical path differencexcan be expressed as
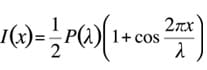
In actual Fourier transform, the AC component (cos) in the above expression forms the interferogram with respect to infrared light at wavelength λ.
As the light actually emitted by the light source combines light at various wavelengths, the interferogram obtained is the sum of the expression above at various wavelengths λ.
If the optical path difference is zero (0), the light is reinforced at all wavelengths, such that the interferogram exhibits high intensity. This is called "center burst."
Fourier transform is the process of calculating the wave intensity at each period from the sum at all wave periods.
Applying Fourier transform to an interferogram obtains the intensity at each period, that is, at each wavelength.
If an interferogramI(x) for infrared light at continuous wavenumbers can be created using the wavenumber ν instead of the wavelength λ,I(x) can be expressed as
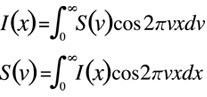
Where,S(ν) is the infrared light intensity at wavenumber ν.
S(ν) can be calculated by Fourier transform.
The data obtained is a power spectrum. The ratio between the background and the sample power spectrum produces a spectrum expressed as transmittance.
Apodization
As described above, a transmittance spectrum (or a spectrum converted to an absorbance spectrum) is obtained when Fourier transform is applied to the measured interferogram.
However, the description above applies to a theoretical situation. Actual measurements differ from the ideal state.
In particular, the integration range for the expression above is from 0 to infinity. This supports an infinite range of movement of the moving mirror. However, such a movement is impossible. The moving mirror reciprocates through a finite distance, such that in practice this integration has to be cut off in a finite range.
For example, if the integration range is restricted to [-L, L], such that the contributions outside this range are not calculated, the Fourier transform expression can be written as
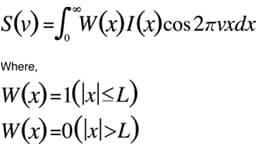
What effect does this calculation have on the spectrumS(ν) that is obtained?S(ν) incorporates images from the Fourier transform of functionW(x). The Fourier transform of functionW(x) produces
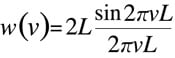
Ripples are formed around a large peak.
Box-car waveformW(x) andw(ν)
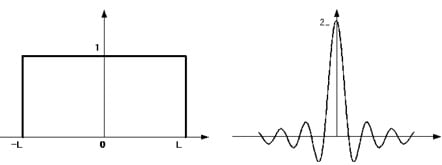
Incorporatingw(ν) into spectrumS(ν) results in ripples likeW(x) around a peak in the spectrum. For a simple box-car waveform such asW(x) above, the largest ripple after the peak is the adjacent valley, which has a depth of approximately 21 % peak height. If the ripples are large, the spectrum obtained contains irregularities analogous to peaks, and it will differ from the actual spectrum.
However, if we use a triangular waveform instead of suddenly discontinuing the calculation in the integration range, we get
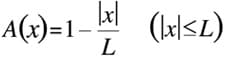
If this is used instead ofW(x) above, the Fourier transform imagea(ν) becomes
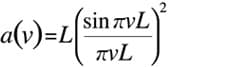
Triangular waveformA(x) anda(ν)
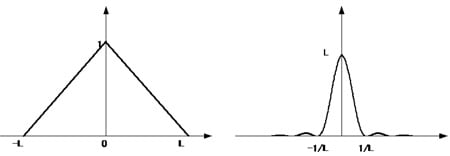
At a glance, it is apparent that the ripples are smaller.
This is because the integration is not suddenly discontinued at the limit. Rather, the contributions decrease at a constant rate as the limit is approached.
However, the central peak is also lower and somewhat wider. This appears as reduced resolution in the actual spectrum.
Applying some type of function to Fourier transform integration to reduce the ripples, as in this example, is called "apodization" and the function is known as an "apodization function." It can be seen from the examples of the box-car waveform and triangular waveform that reducing the ripples implies a compromise between the resolution and peak height. Improving one makes the other worse. Therefore, the apodization function must be selected to suit the intended purpose.
The Happ-Genzel function is often used to achieve a good balance between ripple size and resolution.
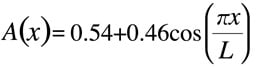
Applying it to the Fourier transform image gives
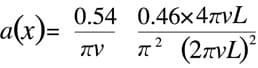
Happ-GenzelA(x) anda(ν)
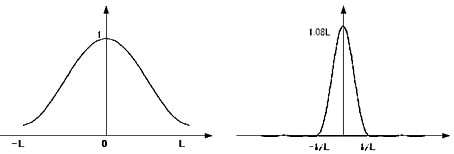
The Fourier transform image shows a high central peak and well-suppressed ripples.
The Happ-Genzel function is normally used. However, in cases where good resolution is required, such as gas measurements, the box-car function is used.
The apodization functions must be separated according to the intended purpose, as shown above.
Appendix: Major Apodization Functions
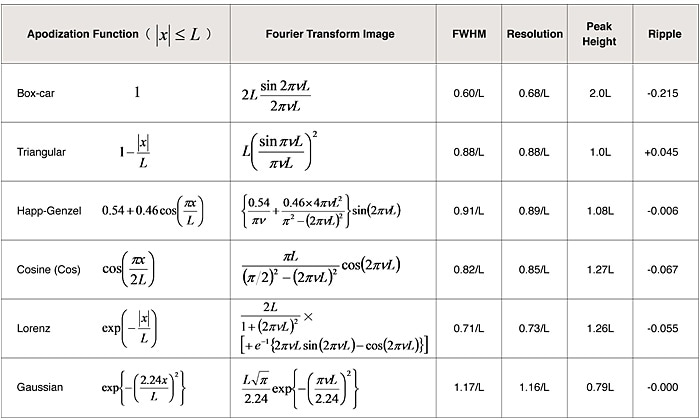
Note) The resolution applies to a 2 % dip with respect to the peak height. The ripple value expresses a proportion of the peak height.
Errata
Appendix: Major Apodization Functions
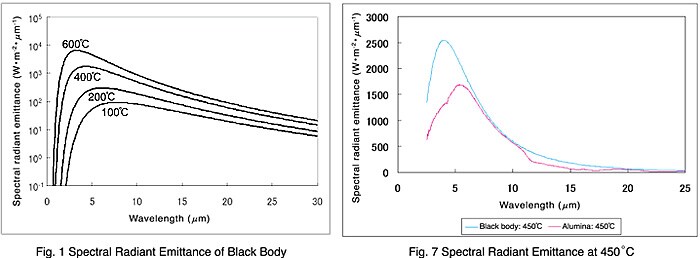
Incorrect diagrams appeared in the article "Spectral Emissivity Measurement Using FTIR Spectrophotometry"
in FTIR TALK LETTER Vol. 13.
We apologize for the inconvenience. Please replace the diagrams, as follows.
Replace Fig. 1 and Fig. 7 with the diagrams below.