How to Read Power Spectra
Molecular Spectroscopy
In Fourier transform infrared spectrometers, a background measurement is casually made before the sample measurement. However, if this measurement will be made carefully, you can obtain more satisfactory measurements.
Now select the 'Measurement' tab and check the box beside 'Display Background (K)' (Fig. 1) to carry out a background measurement.
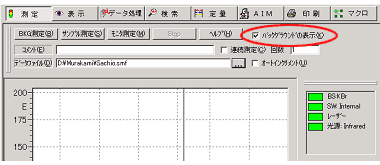
Figure 1 Measurement screen
Fig. 2 shows the background measurement taken with the standard parameters. The result is referred to as a Power Spectrum because the actual signal intensity distribution is displayed for each wavelength. The final transmission spectrum of a sample is obtained by dividing power spectrum of the sample measurement by that of background measurement. The data obtained for those wavenumbers with a stronger signal intensity will have less noise.
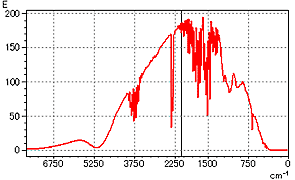
Figure 2 Power Spectrum of Background Measurement
From the Power Spectrum, the measurement region and the level of noise in that region are identified. Looking at the spectrum in Figure 2, the signal intensity in the vicinity of 2000 cm-1 is strong and then becomes weaker on either side of this value. On the long wavelength side, the signal reaches almost zero at 350 cm-1, which indicates that measurements cannot be made at longer wavelengths (0- 350 cm-1). On the short wavelength side, the intensity gradually drops off until approximately 5200 cm-1 and then rises again in the region around 5800 cm-1. It then gradually decreases up to 7800 cm-1 but never completely reaching zero.
The S/N ratio will be better in the wavelength regions where the signal intensity is stronger. Therefore, the best S/N will be obtained in the vicinity of 2000 cm-1. The ratio will obviously decrease in the vicinity of 400 cm-1 and shorter than 5000 cm-1. You can confirm that a measurement can be made in the region of 350-7800 cm-1 under these conditions from the entire Power Spectrum.
The following factors will affect changes in the intensity at individual wavelengths in these Power Spectra.
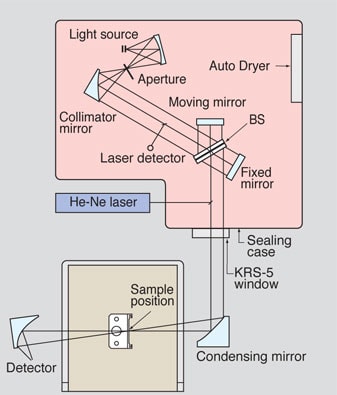
igure 3 Schematic diagram of the IRPrestige-21 optical system
(1) Type and luminosity of the light source
(2) Material of the beam splitter
(3) Window in the sealing case of the interferometer
(4) Type of infrared detector and window
(5) Internal amplifier filter
(6) Accessories used
We will now discuss the effects of the individual factors on the spectral intensity.
(1) Type and luminosity of the light source
A high-luminosity ceramic is used as the infrared light source in the IRPrestige-21 and the FTIR-8400S. The luminosity of approximately 1200 °C is held constant over time by both an applied voltage control system in the lighting up circuit and a heater unit enclosed in the ceramic. The heater unit has a long operational life ensuring the durability of the high surface temperature.
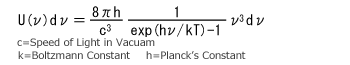
Bodies that emit light at all wavelengths are referred to as black body radiators. The emission of the ceramic light source may be approximated as pseudo-black body radiator. The spectral distribution for the light source can be determined from the Planck's Radiation Law or the Planck Radiation Formula:
(2) Material of the beam splitter
For the middle infrared region, germanium is used for the beam splitter. The extremely thin nature of the beam splitter, with a thickness measured in microns, dictates that the germanium be deposited by vapor-deposition on IR-transparent material (e.g., potassium bromide).
IR-transparent materials are various substances that do not absorb light in the IR region of the electromagnetic spectrum.
(3) Aperture plate interferometer casing
When the humidity increases inside the interferometer deliquescence occurs which ultimately hinders the unit from being used for measurements. Deliquescence is the phenomenon by which crystals absorb moisture, swell, and undergo breakdown. In a climate with high temperatures and high humidity, it is important to take adequate steps against deliquescence within the FTIR. KRS-5 is used as the exit aperture plate for the airtight interferometer casing in the FTIR-8400S and IRPrestige-21 because of its excellent moisture resistance. Our KRS-5 aperture plate possesses the following characteristics: Wavelength transmission region: 16600-250 cm-1 Transmittance: 70 %T The KRS-5 plate was adopted for use in the present instrument because the increased reliability with respect to moisture out weighed the loss of throughput (30 %).
(4) Infrared detector and aperture plate
Standard infrared detectors are equipped with a DLATGS pyroelectric element. The designation comes from an abbreviation that stands for deuterated L-alanine triglycine sulfate. Since the properties of the DLATGS elements change with temperature, the temperature is controlled to maintain stable sensitivity.
Moreover, since these DLATGS elements can undergo deliquescence, a KRS-5 aperture plate is used to block out external air.
When the signal from the incoming infrared light changes rapidly, the DLATGS element has the property (frequency dependence) that allows it to decreases the output signal strength. Consequently, if the mirror speed is increases to 9.0 mm/s from the usual rate of 2.8 mm/s, the signal output will decrease and the power spectrum intensity will drop to 1/3 of the normal level.
Another option is to install the MCT quantum detector which does not display as large of a frequency dependence as the DLATGS detector. Therefore, there will be less dramatic decrease in the output signal, when the mirror speed is set to 9.0 mm/s. This is the main reason that this high sensitive detector is utilized in an infrared microscope for measurements and time-variable measurements that require high speed.
However, the MCT quantum detector requires cooling with liquid nitrogen. It also displays a drop in sensitivity in the vicinity of 700 cm-1 and drops nearly to zero on the longer wavelength (lower wavenumber) side.
(5) Internal amplifier filter
Electronic amplification is important for processing the infrared interference signal input from the detector. First, the signal from the low wavenumber side (long wavelength side) is run through a high-pass filter in order to remove noise due to commercial frequencies (60 Hz and 50 Hz), and then a low-pass filter is used on the signal from the high wavenumber side (short wavelength side) in order to avoid folding (overlapping) due to the sampling theorem.
(6) Accessories used
The measurement region can also be limited by the accessories used. For example, when utilizing the ATR technique, the measurement region is intrinsically limited by the material of the prism.
In addition, for accessories that employ infrared transmission aperture plates (e.g., liquid cells, solid cells, and gas cells) each of the various materials used can have a different transmission range and transmittance. Care should be taken to ensure that the intensity distribution will be satisfactory prior to making the measurement.
| Substance | Wavelength region | Transmittance (thickness) |
|---|---|---|
| Germanium (Ge) | 5500 - 660 cm-1 | 50 %T (2mm) |
| Zinc selenide (ZnSe) | 10000 - 500 cm-1 | 65 %T (1 mm) |
| KRS-5 (note) | 16600 - 250 cm-1 | 70 %T (2 mm) |
| Potassium bromide (KBr) | 40000 - 340 cm-1 | 90 %T (5 mm) |
| Sodium chloride (NaCl) | 50000 - 600 cm-1 | 90 %T (5 mm) |
| Diamond | 40000 - 30 cm-1 | 70 %T (1 mm) |
| Potassium chloride (KCl) | 40000 - 500 cm-1 | 90 %T (10 mm) |