AAPS Pharm Sci 360 2026 (American Association of Pharmaceutical Scientists)
October 26-28
Ernest Morial Convention Center
New Orleans, LA
Booth #1204
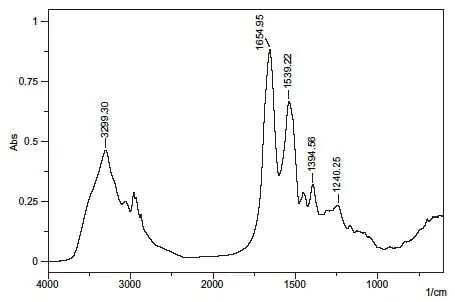
Fig. 1 Transmission Spectrum of Protein (Bovine Serum Albumin)
X-ray diffraction analysis and NMR are widely used for the structural analysis of proteins. However, infrared spectrophotometry is used for the secondary structural analysis, such as α-helices and β-sheets. As infrared spectrophotometry makes it easy to measure samples in all forms (solid/liquid and crystalline/non-crystalline), it is used to complement the analytical methods mentioned above. Find out more below how Shimadzu’s line of FTIR spectroscopy instruments can elevate your protein research needs.
Fig. 1 shows the transmission spectrum of bovine serum albumin. The peak near 1650 cm-1 in Fig. 1 is the amide I band. It results from the C=O stretching vibrations of the peptide bond.
Similarly, the peaks near 1540 cm-1 (N-H bending vibration/C-N stretching vibration) and 1240 cm-1 (C-N stretching vibration/N-H bending vibration) are called the amide II band, and amide III band, respectively. The peak near 3300 cm-1 is thought to be N-H bending vibration and the peak near 1400 cm-1 to result from protein side-chain COO-.
As the absorption peak position and shape of the amide I band differ according to the secondary structure, peak analysis can yield information on the secondary structure.
An infrared spectrophotometer is mainly used to estimate the structure of organic compounds (qualification). This instrument shines infrared light onto the molecules, which absorb infrared radiation equivalent to the interatomic vibrational energy of the atoms that comprise the molecules. It then estimates the structure and quantifies the compound by investigating this IR absorbance.
Proteins can perform a wide variety of molecular functions due to their unique conformation. There are two different representations encoding the structural conformation of proteins, which are the secondary structure and tertiary structure. The secondary structure of proteins is characterized by the repetitive folding pattern of helices, sheets, turns and disordered coils. Different techniques such as X-ray crystallography and nuclear magnetic resonance (NMR) spectroscopy have been widely used to investigate the conformation and stability of secondary structure in proteins. However, these techniques are costly and require specific and time consuming sample preparation steps. Fourier transform infrared (FTIR) spectroscopy is suitable to determine the secondary structure of proteins due to its versatility and high sensitivity towards chemical composition of molecules. The secondary structure composition of proteins could be obtained from the amide band I ranging from 1600 cm-1 to 1700 cm-1 of the IR spectrum. Each type of the secondary structure has its specific spectral band which overlaps in this region. Mathematical procedures such as band curve-fitting and second derivatives can be applied to resolve the overlapping amide I band components and to quantify the secondary structure of proteins. In this application news, we examine the secondary structure of proteins by using FTIR transmission spectroscopy and band curve-fitting data analysis.
Amyloid-β is a peptide that consists of approximately 40 amino acid residues. Amyloid fibrils (fibrous aggregates), which occur as a result of the formation of parallel β sheets by intermolecular association of amyloid-β, are the main component of the senile plaques (amyloid plaques) seen in the brains of Alzheimer’s disease patients. Moreover, the formation mechanism and structure of amyloid fibrils have attracted great interest, as amyloid fibrils are also implicated in other neurodegenerative diseases, including Parkinson’s disease. With FTIR, it is possible to evaluate the aggregation of amyloid- β by analyzing the amide I band around 1,650 cm-1, which originates from stretching vibrations of the C=O group of the peptide bond. Fig. 1 shows the peptide bond structure. The secondary structures (α-helix, β-sheet, β-turn, random coil, and other local 3-dimensional conformational features) of the amyloid-β peptide can be obtained by curve fitting (peak splitting). Curve fitting is method in which the waveforms of each absorption band are expressed by an approximate curve such as a Lorentzian curve or Gaussian curve, and the peak information (position, intensity, full width at half maximum) of the approximate curve of each absorption band is optimized so as to minimize the difference between the calculated spectrum and the measured spectrum. This article introduces the results of an evaluation of amyloid-β aggregation.
AAPS Pharm Sci 360 2026 (American Association of Pharmaceutical Scientists)
October 26-28
Ernest Morial Convention Center
New Orleans, LA
Booth #1204
ASMS (American Society for Mass Spectrometry) 2026
May 31 - June 4
San Diego Convention Center
San Diego, CA
Suite 5, 6
Pharma Community Network Event
Shimadzu Scientific Instruments and ZefSci invite you and your analytical teams to a pharma community networking event to celebrate 150 years of science and innovation at The Foundry & Lux in South San Francisco. Our event will be built around innovation, collaboration, and connection.
Shimadzu Scientific Instruments Opens Boston Location of Its R&D Center Focus will be on promoting customer-oriented development to expand business in the pharmaceutical field
Shimadzu Scientific Instruments, Inc. (SSI, Columbia, Maryland, USA), a Shimadzu Group company, has opened a satellite lab in Boston, Massachusetts to be the base of its collaborative research and development activities on the East Coast. Established to conduct research and development more closely linked to customers, SSI's R&D Center consists of three bases, with the main facilities at its Maryland headquarters, a West Coast location, and this new space in Boston near the city center. The Boston lab was set up by partnering with Labshares, a shared laboratory service provider for life science companies.