Method Development System - Features
Develop Analysis Methods with Higher Reliability More Efficiently
Optimization of Analytical Methods
Efficiently Reduce Method Development Time Using Design of Experiments (DoE)
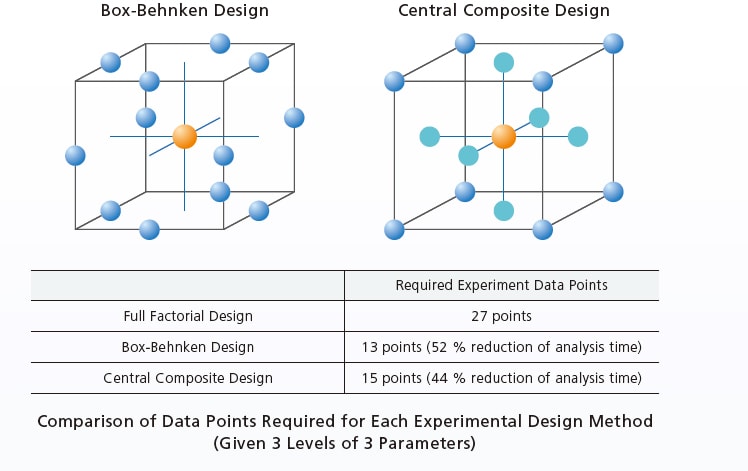
Box-Behnken design and central composite design can shorten analysis times because they require fewer data points than full factorial design. For example, if determining the three optimal levels for the organic mobile phase mixture ratio, pump gradient conditions, and column oven temperature, full factorial design requires 27 data points (3 × 3 × 3) for optimization whereas Box-Behnken design requires 13 points and central composite design requires 15 points.
Easily Create an Analysis Schedule
The process of creating the vast numbers of method files and analysis schedules required for screening can be completed quickly by simply following steps (1) to (6) below. The mobile phase and column to be used can be selected with a single click and a comprehensive schedule reflecting column equilibration and blank analysis is generated automatically. That not only improves operational efficiency, but also can reduce human errors. The experimental design to be used can also be selected with a single click.
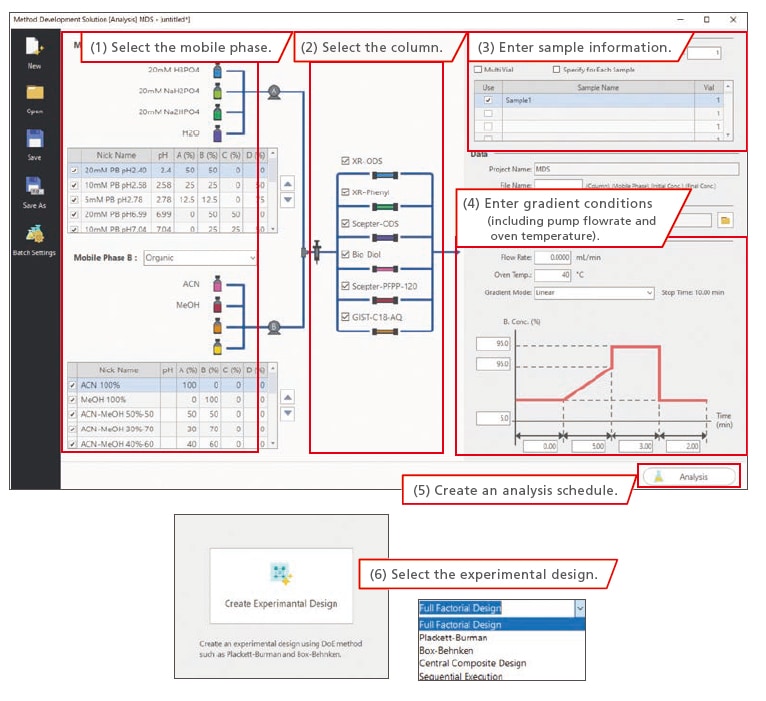
Experimental Design Selection Window
Quickly Find Optimal Analytical Conditions among Vast Amounts of Data
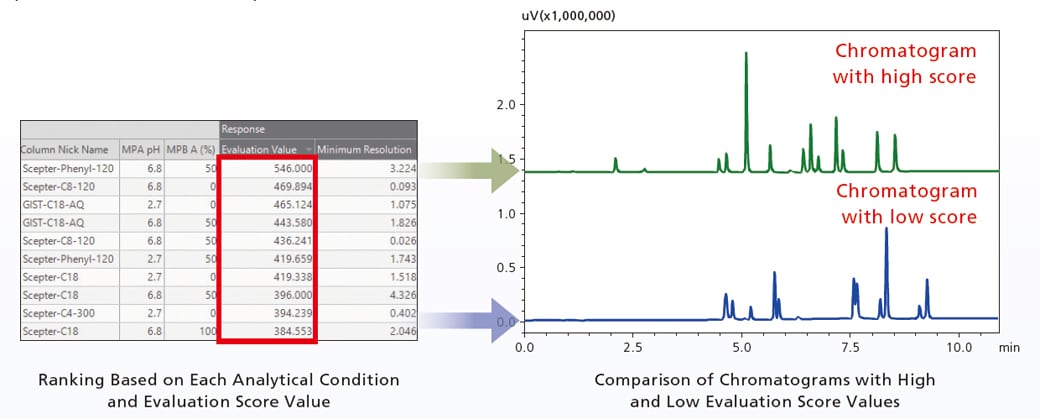
Because screening generates as many chromatograms as the number of conditions considered, they must be evaluated to determine which is optimal. If all the chromatograms had to be scrutinized by a human, it would be very tedious. LabSolutions MD can quickly and easily find optimal analytical conditions using equation (1) below to quantitatively evaluate the separation status resulting from each analytical condition.
E = P×(Rs1+Rs2+…RsP) … (Eq. 1) The evaluation value (E) is calculated as the number of peaks detected (P) multiplied by the sum of the separation level (Rs) for all peaks.
Identify the Most Robust Analytical Conditions by Graphing Factor-Response Relationships
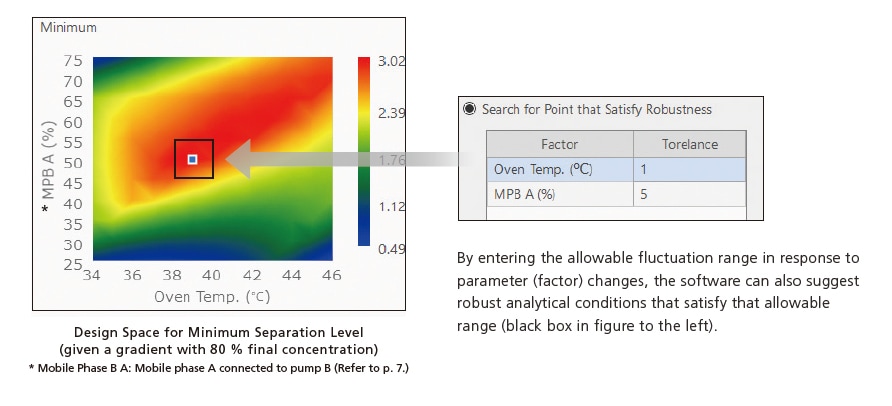
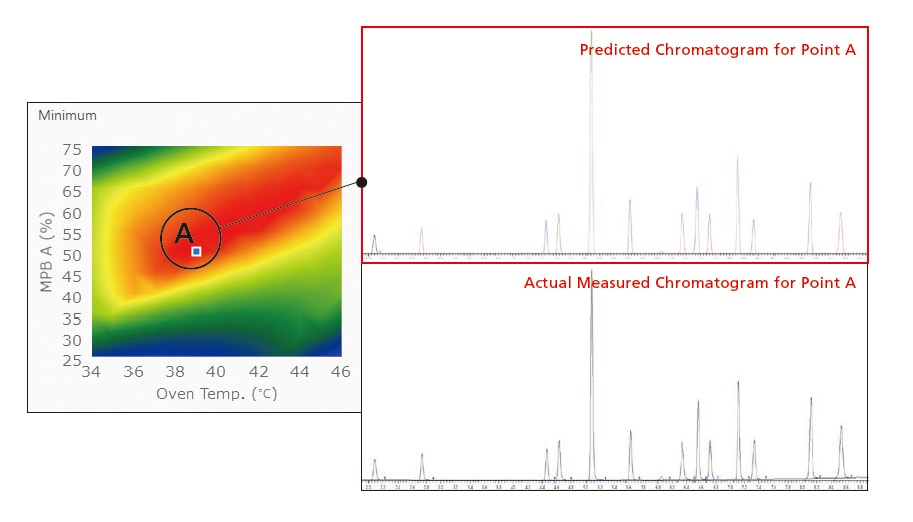
After the aqueous mobile phase pH level and column were selected by initial screening, analytical conditions were further optimized between five organic mobile phase mixture ratio settings (30, 40, 50, 60, or 70 %), three column oven temperature settings (35, 40, or 45 °C), and three gradient final-concentration settings (75, 80, or 85 %). The effect on separation by variations in parameter settings can be visually shown by graphing separation in terms of the organic mobile phase mixture ratio on the vertical axis and column oven temperature on the horizontal axis. That makes it easy to see at a glance that the most robust analytical conditions have an organic solvent mixture ratio of 50 %, a column oven temperature of 39 °C, and a gradient final concentration of 80 %. Consequently, robust analytical conditions can be specified without relying on experience or intuition. It is also possible to visually display variations in the distribution of minimum separation levels in response to arbitrary changes in the gradient final concentration as an additional parameter to the organic mobile phase mixture ratio on the vertical axis and column oven temperature on the horizontal axis.
Chromatograms Resulting from Any Given Analytical Conditions Can Be Predicted
By clicking any analytical condition point (point A in the figure below), chromatogram changes in response to analytical condition changes can be visually predicted. That allows confirming how separation will behave in response to arbitrary changes to analytical conditions prior to starting an analysis.
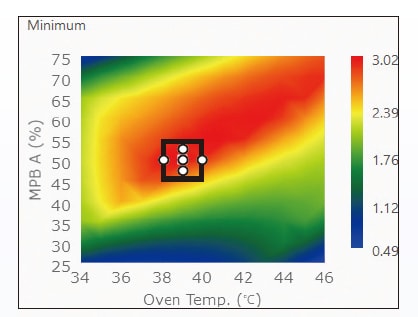
Robustness Validation by Iterative Experimental Design
Whenever analytical conditions are varied, it is important to validate the robustness of the conditions to better understand how those variations will affect measurement values and to ensure the reliability of the analysis method. Iterative experimental design automatically generates a schedule for analyzing a small range of variations in each parameter in the analytical conditions that were determined as optimal. That schedule can be used to evaluate how those variations affect separation. Specifically, it varies the organic mobile phase mixture ratio in 1 % increments (49, 50, and 51 %) and the column oven temperature in 1 °C increments (38, 39, and 40 °C) (area circled in white below) to verify the effect the analytical condition variations have on retention times and separation levels.
The resulting chromatograms obtained for robustness validation are shown below. That makes it easy to check all evaluation points with the chromatograms lined up next to each other. In this case, the setting variations result in very small separation level and retention time fluctuations and quickly show the robustness of the optimized analytical conditions.
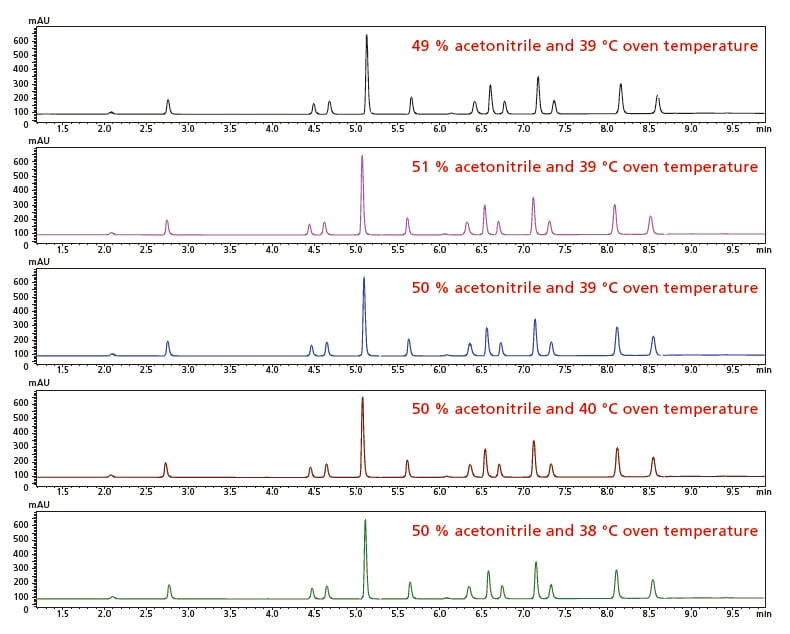
Chromatograms Obtained at Each Robustness Validation Data Point
Automatic Identification of Target Compounds by Peak Tracking
Parameters Usable for Automatic Peak Tracking
Similarity scores, area values, or other user-specified parameters can be used to automatically track variations in retention time for each compound in response to changes in analytical conditions. Even if analytical conditions change peak elution positions, peak tracking can quickly and automatically recognize peaks from all data and without requiring additional work for identification.
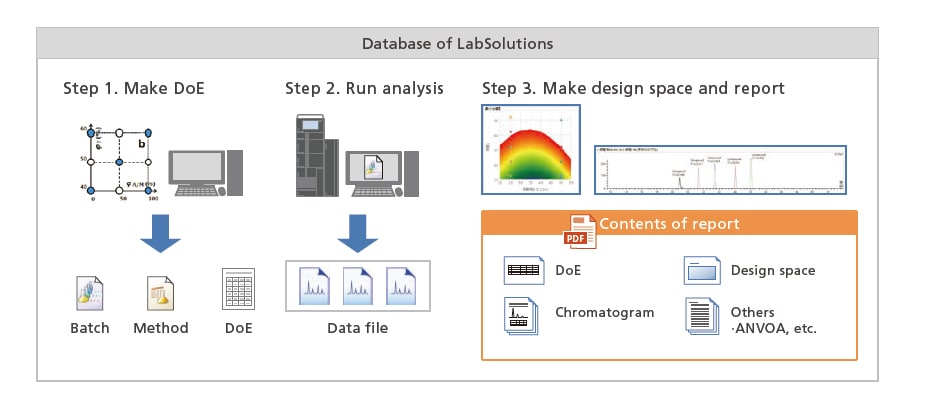
Ensure Data Integrity by Database Management
It is easy to check analysis results using LabSolutions MD because all associated information, such as the experimental design, design space, and chromatograms, are output in a report. It also ensures data integrity by managing outputted reports together with the corresponding experimental design file, method file, batch file, and data file within a LabSolutions database.
Due to the seamless integration of all process steps, including creating an experimental design, acquiring data, and all method development steps in the design space, LabSolutions MD eliminates the need for any time-consuming file importing or exporting steps.
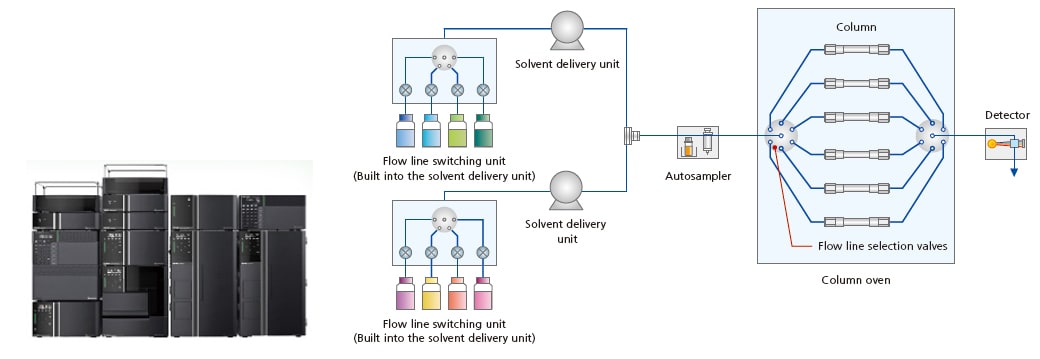
Save Labor by Switching between Mobile Phases and Columns Automatically
Nexera™ Series
These ultra high performance liquid chromatographs have a maximum pressure capacity of 130 MPa and support up to 192 combinations of 8 types of mobile phases and 12 types of columns (4 × 4 × 12).
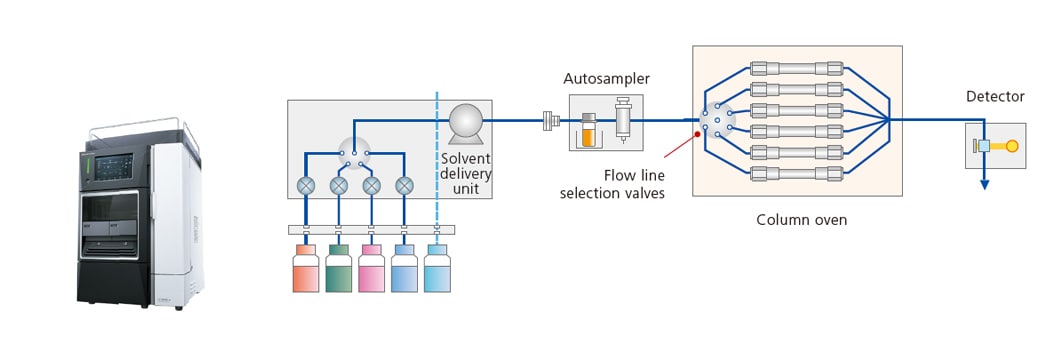
i-Series
These space-efficient and cost-efficient integrated LC systems support pressures up to 70 MPa.
Mobile Phase Blending Functionality Reduces Labor
The mobile phase blending functionality can dramatically reduce the amount of time previously required for mobile phase preparation by automatically preparing mobile phases with the user-specified pH level or the organic mobile phase mixture ratio using only a few types of mobile phases prepared in advance. i-Series systems can use a low-pressure gradient to blend up to two types of aqueous and two types of organic mobile phases.
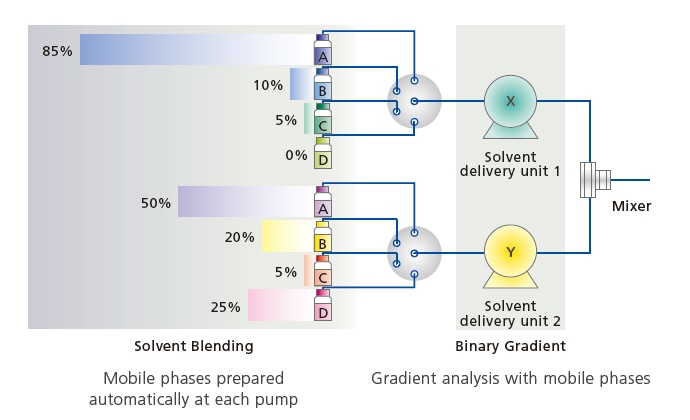
Automatic Mobile Phase Preparation Using the Mobile Phase Blending Functionality
(in Nexera systems configured with high-pressure gradient capability)