Analysis Results
3.1. Information Obtained from the Analysis Results
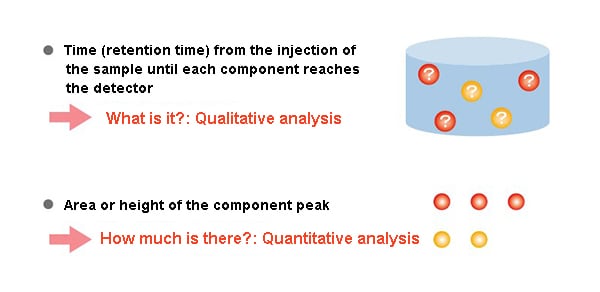
The time (retention time) until the injected sample reaches the detector is a characteristic value of each component.
Investigating the retention time under given analysis conditions makes it possible to determine what a component is (qualitative analysis).
Additionally, the size of the component peak, in other words its area and height, makes it possible to determine how much of the component there is (quantitative analysis).
3.2. Qualitative Analysis
The elution time when analyzed under given conditions is a characteristic of each component. In other words, when the same component is analyzed under the same conditions, a peak is confirmed at the same time.
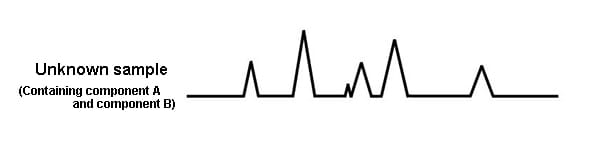
For example, imagine an unknown sample known to contain component A and component B.
The chromatogram obtained from the unknown sample looks as follows. It is not possible to know which peak is component A, and which peak is component B.
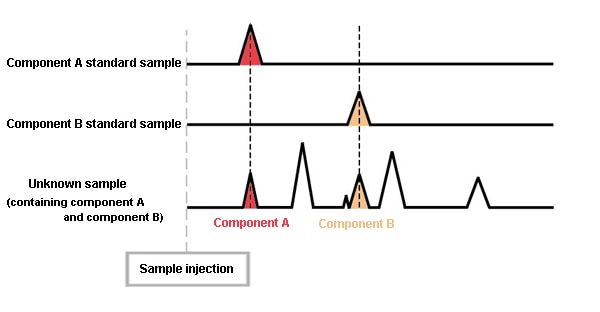
However, if standard samples of A and B are prepared, and are analyzed under the same conditions, the retention times for A and B become evident. By comparing these chromatograms, the peaks for A and B in the chromatogram of the unknown sample can be determined. When analyzed under the same conditions, the same component always elutes at the same time. (The retention times are equivalent.)
|
With GC, the retention time is the sole qualitative information. |
With GC, the retention time is the sole qualitative information. For this reason, if a standard sample is not available, it is not possible to determine what a peak is. Accordingly, one could say that this method is intended for the analysis of samples for which the components they contain are reasonably certain. To investigate samples containing unknown content, it is necessary to use analysis methods with a higher qualitative capacity such as GCMS. At the same time, it’s important to note that components exist with the same retention times under given analysis conditions. In other words, a seemingly single peak could indicate multiple components. In this case, cross checks must be performed by changing the column or the temperature conditions. For this reason, when performing GC analysis, it’s very important to completely separate the peaks.
3.3. Quantitative Analysis
In a GC chromatogram, the size and area of the component peak are proportional to the amount of the component reaching the detector.
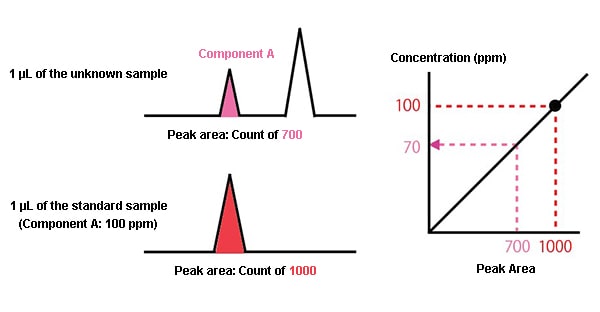
Here, we describe a quantitative analysis investigating the concentration of component A in an unknown sample.
First, 1 μL of the unknown sample is analyzed, and the area of the peak for component A in the chromatogram obtained has a count of 700.
Next, a standard sample is prepared with a concentration of component A of 100 ppm. 1 μL of this is analyzed under the same conditions, and a count of 1000 is obtained as the peak area.
The peak area is proportional to the amount of the component, so if a 100 ppm concentration has a count of 1000, a 700 count means a 70 ppm concentration.
As with qualitative analysis, one could say that a standard sample is also required for quantitative analysis.
The area (height) of the component peak is proportional to the amount of component reaching the detector.
(Note: In FPD S mode, it is proportional to the square of the component amount.)
|
A standard sample is also required for quantitative analysis. |
3.4. Quantitative Methods
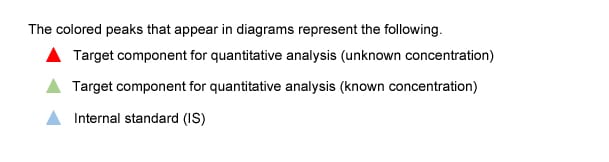
3.4.1. Percentage Peak Area Method
The percentage peak area method uses the area of the target component (component A) peak as a proportion of the total area of all detected peaks to analyze quantity.
This method is used to determine changes in concentration of a known sample mixture, or to determine an approximate concentration of a sample mixture.
Advantages: Simple analysis since no standard sample is used.
Disadvantages: Reduced quantitation accuracy due to the effect of relative component sensitivity.
*Notes
- All sample components must be detected.
- All components must have the same relative sensitivity.
|
Component A concentration is 1000/4500 = 22.2 % |
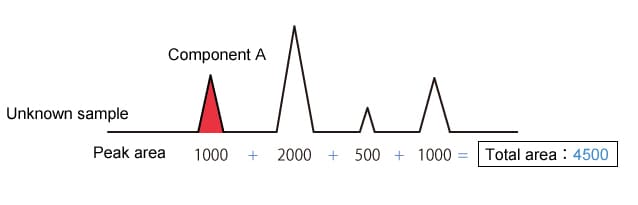
3.4.2. Corrected Percentage Peak Area Method
The corrected percentage peak area method is the percentage peak area method with compensation for the relative sensitivities of each component.
Advantages: Performs quantitative analysis by the percentage peak area method but with compensation for relative component sensitivity.
Disadvantages: Requires a standard sample containing all components in known concentrations.
*Notes
- All sample components must be detected.
|
Component A concentration is 500/2417 = 20.7 % |
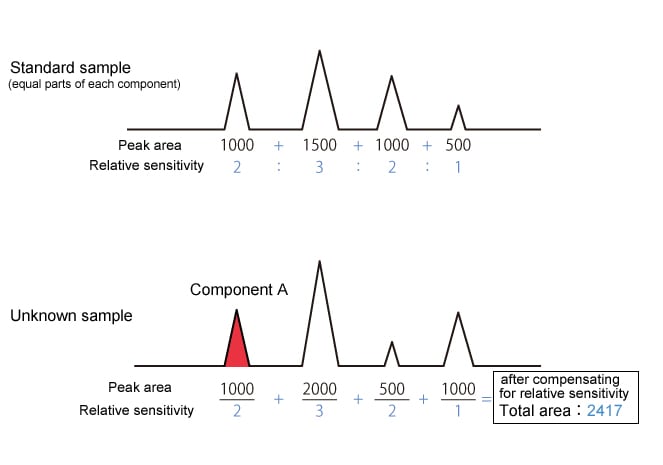
3.4.3. Absolute Calibration Curve Method (External Standard Method)
The absolute calibration curve method uses a standard sample of known concentration to prepare a calibration curve, then uses this curve to quantify components in an unknown sample.
Analysis can be relatively simple since only the target component needs to be detected to determine quantity. This is also the most popular method of quantitative analysis.
Advantages: Quantitative analysis requires only separation and detection of the target component.
Disadvantages: Sample injection volume errors carry over as errors in quantitative results.
|
Component A concentration is 70 PPM |
3.4.4. Internal Standard Method
The internal standard method calculates the target component concentration based on the relationship between the peak area ratio and concentration ratio of the target component and an internal standard.
Advantages:
- Quantity can be calculated as long as the target component and internal standard are detected.
- Concentration ratio is not dependent on injection volume, so this method compensates for injection volume errors.
- Not susceptible to different sample densities caused by different sample compositions.
Disadvantages:
- Requires a standard sample containing a known concentration of the target component and the internal standard.
- The internal standard must be added to all unknown samples to obtain an accurate concentration.
*Notes
Selecting the internal standard can be difficult as it must fulfill all the requirements shown below.
- Is separated almost completely from all components in the sample.
- Is eluted close to the target component.
- Has similar chemical properties to the target component (homologue, etc.).
- Is chemically stable.
|
Concentration of target component in unknown sample |
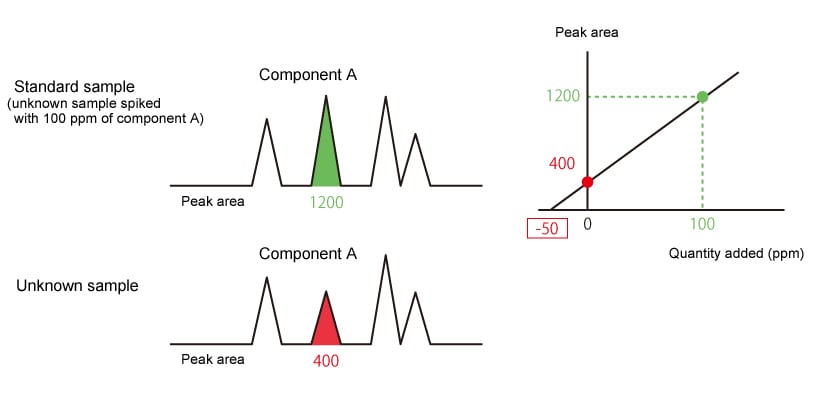
3.4.5. Standard Addition Method
The standard addition method analyzes an unknown sample and the same unknown sample spiked with a known amount of target component, then uses the difference between detected peak areas (peak height) to determine quantity. This quantitative method is often used to analyze samples containing a target component affected by the concentration of other components in the sample, such as odor component analysis and headspace analysis.
Advantages:Other components in the sample (matrix) can mitigate the effect (matrix effect) of changes in sample composition when introduced to a gas chromatograph.
Disadvantages:Extra work is required to add the target component to the unknown sample. Because a target component is added to the unknown sample (sometimes multiple quantities), rare samples cannot be used.
|
The concentration (ppm) of component A in the unknown sample is shown by the absolute |