Microscope Measurement Techniques
Molecular Spectroscopy
In this article, we introduce analytical techniques using IR microscope transmission methods.
Diamond cells or a KBr or BaF2 window material are often used for transmission measurements. However, great care is needed to obtain good quality spectra with such cells. Four important precautions when conducting measurements with a diamond cell are described below.
(1) Using a Diamond Cell
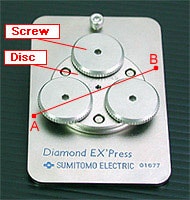
Diamond Cell The sample is flattened out between two disks.
A diamond cell incorporates two cell plates, which compress the sample. Subsequently, measurements are conducted on the sample adhered on a single cell plate.
If measurements are conducted with both cell plates, an interference pattern is superimposed over the sample spectrum.
Fig. 1 shows the example of caffeine powder analyzed using a diamond cell. The red line shows the spectrum of the sample on a single cell plate; the blue line shows the spectrum measured with the sample sandwiched between two cell plates.
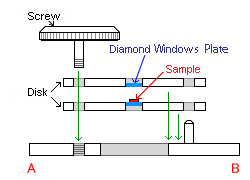
Diamond Cell Structure (cross-sectional diagram at A-B in the left-hand figure)
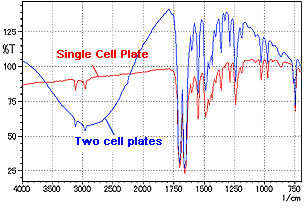
Fig. 1 Transmission Spectra of Caffeine Powder (difference between single and two cell plates)
Fig. 1 shows that an interference pattern is superimposed over the sample spectrum measured using two cell plates, such that the baseline exceeds 100 %. The interference pattern occurs due to the parallel space between the two diamond disks.
When measurements are conducted with two cell plates, the noise increases near the 2000 cm-1 absorption band of diamond.
For the reasons above, after a sample is crushed between the two cell plates, the sample adhered on a single cell plate is analyzed. As an exception, rubber and other elastic samples are measured while sandwiched between the two cell plates.
(2) Sample Quantity
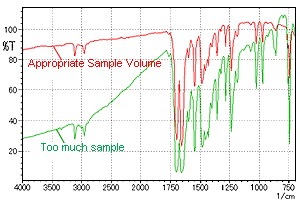
Fig. 2 Transmission Spectra of Caffeine Powder (effect of sample amount)
Only a trace amount of sample is required for measurement. Too much sample lowers the baseline and results in a spectrum with saturated peaks. Fig. 2 shows an example of this using a caffeine power sample. The red line shows the spectrum obtained with an appropriate sample volume; the green line is the spectrum for an excess of sample. As an excess of sample cannot be compressed thinly enough, measurements must be conducted on a thick film. This results in a spectrum that is difficult to analyze due to a lower or inclined baseline and saturated peaks, as shown by the green line in Fig. 2. Therefore, the amount of sample must be adjusted to create a thin layer on the diamond cell.
(3) Background (BKG) Measurement and Sample Measurement Positions
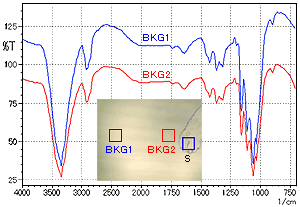
Fig. 3 Transmission Spectra of Fibrous Foreign Matter (effect of background measurement positions)
The positions chosen for background measurement and sample measurement have an influence on the spectrum.
Choosing a background measurement position as close as possible to the sample measurement position achieves a good spectrum with approximately 100 % baseline.
Fig. 3 shows the spectra for cellulose fiber obtained with BKG measured in a corner of the diamond cell (BKG1) and with BKG measured near the sample (BKG2).
The amount of transmitted IR light differs between the center and edges of the diamond cell. The amount of IR light is lower if BKG is measured away from the center of the cell. In this case, sample measurements result in a spectrum with a baseline exceeding 100 %. Consequently, position the sample in the center of the diamond cell and measure the background as close to the sample as possible. If the sample is not in the center of the diamond cell, the background must also be measured near the actual sample position, away from the center of the cell.
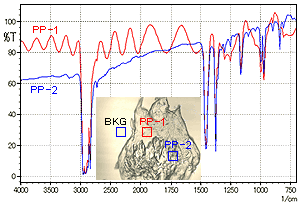
Fig. 4 Transmission Spectra of Polypropylene (PP) (effect of sample measurement positions)
An interference pattern may appear on the baseline if it is measured on a smooth part of the sample surface. Fig. 4 shows examples of polypropylene (PP) measurements. The insert shows a photograph of the actual measured positions.
Care is required if an interference pattern appears on the baseline, as the interference pattern may hide small peaks.
(4) Using the Aperture
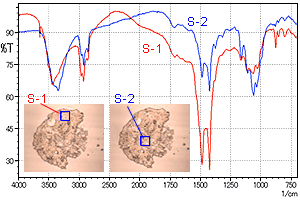
Fig. 5 Transmission Spectra of Foreign Matter on the Surface of Paper (at two different measurement positions)
If the foreign matter (sample) is relatively large, do not increase the aperture. It is more effective to set the aperture to approximately 50 µm and measure the spectra at a variety of positions than to increase the aperture. Constant results at each measurement position indicate that the foreign matter is a single component or a uniform mixture. Sample identification and analysis by spectrum searching are possible on a spectrum not affected by peak saturation or an interference pattern.
However, differences apparent between the spectra indicate a non-uniform mixture of foreign matter. In this case, differential spectra are determined to obtain a spectrum for each component. Fig. 5 shows the measurement of foreign matter on the surface of paper. The aperture is set to 30 µm × 30 µm.
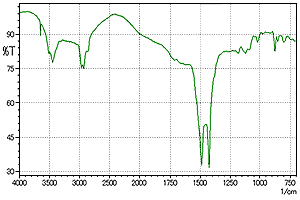
Fig. 6 Differential Spectrum
The diagram shows a position of strong intensity near 1500 cm-1 (S-1) and a position of strong intensity near 1000 cm-1 (S-2). The position near 1000 cm-1 results from a normal component of paper (cellulose). Calculating the difference between the spectra from S-1 to S-2 in Fig. 5 gives the spectra for just the foreign matter. Fig. 6 shows the resulting differential spectrum.
Spectrum searching of the differential spectrum in Fig. 6 indicated the foreign matter to be magnesium carbonate.
This FTIR Talk Letter introduced four important precautions when using a diamond cell for transmission methods with an IR microscope. Follow these precautions to more effectively utilize your IR microscope.