Microscope Measurement Techniques - Reflection and ATR Measurements
IR Microscope Reflection Method Precautions
The IR microscope reflection technique is extremely simple, requiring almost little or no sample preparation. However, measurements are limited to certain forms of samples. One of the typical samples suited to microscope reflection measurement is foreign matter adhering to a highly reflective metal substrate. Three precautions related to IR microscope reflection analysis of samples adhering to a metallic plate are described below.
Fig. 1 Schematic Diagram of a Thick Sample Adhering to a Metallic Plate
1. Analysis of a Thick Sample
Analysis of a thick object adhering to a metallic plate surface is illustrated in the schematic diagram of Fig. 1.
The specular reflection from the sample surface, as indicated in Fig. 1, is about 5 % of the total incident light. In Fig. 1, the sample is thick enough so that even if some light is reflected from the metal surface, almost zero light will be reflected from the sample surface. The specular reflectance spectrum obtained here displays a distortion in the first derivative spectrum due to a large change in the reflectance (refractive index abnormal diffusion) where strong absorption occurs. However, a spectrum similar to an absorption spectrum can be obtained by applying Kramers-Kronig (K-K) analysis.
Typically, less light will reach the detector during a Fig. 3: Spectrum after K-K Analysis reflectance measurement with an IR microscope as compared to a transmission measurement. Especially when analyzing a thick sample in reflection mode, the amount of light is markedly decreased, requiring considerable integration to improve the signal-to-noise ratio.
Fig. 2 shows a measurement example of a glossy coating sheet (about 1 mm thick) on a metallic plate. Measurement was conducted by focusing on the sample surface and setting the aperture to 30 × 30 µm. In Fig. 2, the peak shows a distortion in the first derivative spectrum as described above, unlike that observed in a normal absorption spectrum. Fig. 3 shows the result of applying K-K analysis to the spectrum of Fig. 2. It is easily determined from Fig. 3 that the coating sheet is polypropylene.
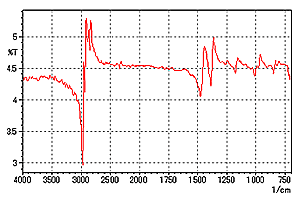
Fig. 2 Specular Reflectance Spectrum of Sheet on a Metallic Plate
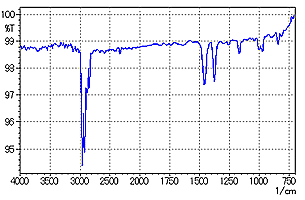
Fig. 3 Spectrum after K-K Analysis
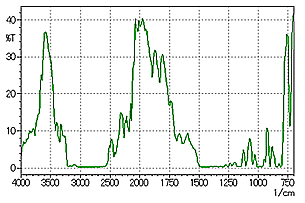
Fig. 4 Reflection Absorption Spectrum of a Sheet on a Metallic Plate
Fig. 4 shows the results of a measurement when focusing on the surface of the metallic plate, rather than the sample surface. In Fig. 4, it is evident that peaks are saturated in the reflection absorption spectrum due to the thickness of the sample.
In this way, when the sample is thick, only the specular reflection spectrum can be obtained if the focus is on the sample surface, and qualitative analysis of the sample is possible by applying K-K analysis. However, with samples like powders and fibers, which have a rough surface, since most of the reflected light is diffused, it is difficult to detect only the specular reflection component from the sample surface. When sampling is possible, the IR microscope transmission method is suitable, and when the target object is protruding from the surface, the IR microscope ATR method is more applicable.
2. Analysis of a Thin Sample
Analysis of a thin object adhering to a metallic plate surface is illustrated in the schematic diagram of Fig. 5.
When the sample is thin, as shown in Fig. 5, incident light is reflected from the surface of the metallic plate, and exits from the surface of the sample. The spectrum obtained in this case is a reflection absorption spectrum similar to that obtained in transmission measurement when large amounts of light are reflected from the metal surface (blue line in Fig. 5). However, if only a small amount of light is reflected from the metal surface, a spectrum consisting of a mixture of pure specular reflection and reflection absorption spectrum is obtained. When such a mixed spectrum is obtained, positive peak distortion (increased transmission) occurs at the higher wavenumber side of peak position, and conversely, negative distortion (reduced transmission) occurs at the lower wavenumber side. This characteristic is the same as the Christiansen effect seen when using the KBr pellet and Nujol mull methods. (Christiansen effect: Phenomenon in which the amount of transmitted light changes in the vicinity of the peak position due to the relationship between the refractive index and reflective one. This often occurs with light-scattering samples.)
Fig. 6 shows a measurement example using a thin sample. Measurement was conducted using a 20 × 20 µm aperture setting. Measurements 1 and 2 show results obtained at different positions. In Measurement 1, a normal absorption spectrum is observed, but in Measurement 2, peak distortion is seen in the vicinity of 1500 cm-1. When this type of spectrum is obtained, since the peak position and absorption intensity are different from the proper values, it is necessary to search for a position where a spectrum like that of Measurement 1 can be obtained. If the target object is extremely small and it is not possible to change the measurement position, use the IR microscope transmission or IR microscope ATR method to obtain an undistorted spectrum.
Fig. 5 Schematic Diagram of a Thin Sample Adhering to a Metallic Plate
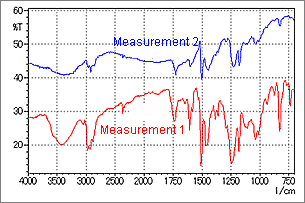
Fig. 6 Spectrum of an Object Adhering to a Metallic Plate Surface

3. Background (BKG) Measurement Position
As described in the precautions required when using the IR microscope transmission technique in Vol. 5, the BKG and sample measurement positions have an influence on the spectrum in the IR microscope reflection method as well. Fig. 7 and Fig. 8 show an example of analysis of an object adhering to a metal plate surface. Fig. 8 shows the spectra obtained by BKG measurements at the two positions (BKG 1 and BKG 2), with the sample position fixed on the foreign matter on the plate.
In Fig. 8, peaks are not as distinguishable in BKG 2 as in BKG 1. It is thought that in BKG 2, a minute quantity of material identical to the foreign matter is stuck to the plate, and the BKG peaks are offset by the peak of the foreign matter. This illustrates the importance of carefully selecting the BKG and sample measurement positions in reflection measurements, like in transmission measurements.
A spectrum search conducted for the red line spectrum in Fig. 8 (BKG 1) revealed that the substance is sodium lactate.
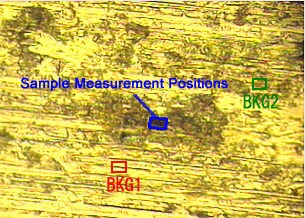
Fig. 7 Microscope Photograph of Foreign Matter on a Plate
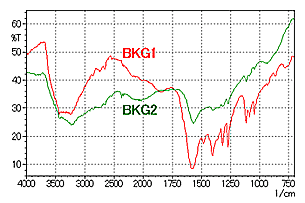
Fig. 8 Spectra of Foreign Matter on a Plate
■ Precautions in IR Microscope ATR Technique
The IR microscope ATR technique is extremely simple, requiring almost no sample pretreatment. However, there are several precautions to be kept in mind when using this method. Three important precautions are described below.
1. Residual Substances on Prism
In analysis using the IR microscope ATR method, the sample is tightly pressed against the prism. Therefore, prior to analyzing another sample, it is necessary to check for any residual sample substance that may have been transferred to the prism, and to clean off this residual material. This operation flow is illustrated in Fig. 9.
After conducting BKG measurement, sample measurement is conducted with the sample pressed against the prism. After that, the sample and prism are separated, and the spectrum is checked using monitor-measurement. If no peaks are seen as shown in the bottom spectrum of Fig. 9, analysis of the next sample is possible because there is no residual substance on the prism. However, if peaks are seen as shown in the middle spectrum of Fig. 9, it indicates the presence of residual substance due to transfer of sample to the prism. In this case, the surface of the prism must be cleaned using, for example, a cotton-tipped applicator soaked in ethanol.
However, if the sample consists of a mixture of substances, it is highly possible that only one of the substances from the mixture is stuck to the prism, and by measuring the transferred spectrum, very detailed information might be obtained. For example, if the foreign matter includes oil, measurement of the sample in contact with the prism will provide a spectrum of both the foreign material and oil, but after separating the prism from the sample, only the oil spectrum will be obtained. Therefore, if a subtraction spectrum is calculated by subtracting the residue spectrum from the spectrum measured in the contact state, a spectrum of the foreign material alone will be obtained.
2. Sample Surface Condition and Contact Position
As measurement using the IR microscope ATR technique requires that the sample and prism closely contact one another, depending on the condition of the sample surface and the contact position, a good spectrum may not be obtained. If the sample surface is irregular, as shown in Fig. 10, a spectrum may not appear depending on the position.
Fig.11 shows an example of IR microscope ATR analysis of dirt stuck to a metal surface. In Fig. 11, peaks can be identified in the blue spectrum (blue-outlined area in the photo), but no distinct peaks are obtained in the red and green spectra (red-and green-outlined areas in the photo). This is probably because it is very difficult to obtain good contact with those areas, or because the adhering material in those areas is very thin. In this way, when no distinct peaks are obtained, it is necessary to change the measurement position.
Fig. 10 Schematic Diagram of Sample and Prism Contact
Fig. 11 Spectra of Dirt on a Metal Surface
3. Pressing Force
When using the IR microscope ATR technique, the spectrum may change according to the force with which the sample is pressed against the prism. Care is especially necessary when the sample is soft. Consider the situation in which a multi-layer soft sample is measured, as illustrated in Fig. 12.
When lightly pressed, a spectrum is obtained only for the green layer in Fig. 12, but as the pressing force is gradually increased, the green layer is gradually stretched thin, and the spectrum of the red layer will be superimposed on that of the green layer.
An example of IR microscope ATR analysis of such a multilayer soft sample according to the above description is shown in Fig. 13. The spectra correspond to pressing force in the order of A < B < C.
It is evident that as the pressing force increases, a peak becomes evident in the vicinity of 1650 cm-1, and conversely, the peaks in the vicinity of 1700 cm-1 and between 1250 and 1000 cm-1 become weaker. The most superficial layer corresponds to spectrum A in Fig. 13, and the compounds in the lower layer can be obtained by calculating the subtraction spectrum between spectra C and A. From the resulting subtraction spectrum, the most superficial layer was identified as urethane, and the inner layer as an amide compound.
Fig. 12 Pressing the Prism Against a Multi-Layer Soft Sample
Fig. 13 Spectrum Change due to Changing Pressing Force